|
|---|
Simulation models of agricultural systems, when coupled with appropriate data sources, have a great potential for bringing agricultural research and development into the age of information technology. Within agricultural disciplines, crop production involves a complexity of interactions between crop genotype, the soil and aerial environment, and management practices. Considerable research has been done on the various components of crop production and some of their interactions. Much research has yet to be done. Some of the information has and is being used in models designed for specific uses such as crop growth, and some is being used more holistically to include broad aspects of agricultural systems.
This book documents a ten year collaborative project with the aim of
producing a "user-oriented," general simulation model of wheat yields. The
model was built to predict the performance of a particular cultivar, sown at
any time, on any soil, in any climate. This goal may never be completely met
due to the complexity of a biophysical system. However, even partially
meeting the goal will provide considerable improvement in our ability to
transfer agrotechnology information. Models help accomplish this goal by
defining a minimum set of soil, weather, management, and genetic information
that should be collected in practically all field experimental trials to help
explain outcomes and thereby transfer the technology beyond the site and year
of the trial.
HISTORY
This wheat modelling effort was started in 1977 when the USDA-Agricultural Research Service was asked to attempt an improvement in the U.S. government's capability to predict domestic and foreign wheat yields. Models prior to that time were mostly statistical, principally using monthly weather data. The CERES-Wheat model was one of three models initially developed by the USDA-ARS (Willis, 1985).
The belief that a crop model could be developed into a relatively simple user-oriented package came from the success of a model developed by one of us (Ritchie, 1972) to predict evaporation from plants and soils with incomplete cover. That model was more empirical than most models that were developed to predict evaporation and it has proven to work quite well under a wide range of conditions although it is not a mechanistic model. A feature that made it useful was the relatively few inputs required compared to a more mechanistic model. However, one constraint limiting the usefulness of the model was that the seasonal variations in leaf area index (LAI), information seldom available from experiments, was a necessary model input. To overcome this problem a model was developed to predict the LAI for a sorghum crop using principles of developmental physiology (Arkin, et al., 1976). LAI was found to be one of the most predictable quantities in crop modeling if the plant population and the leaf size distribution of a plant was known. Limitations of the sorghum model (SORGF) was that the number of leaves had to be input along with maximum leaf sizes because both the genotype and environment can affect leaf number and sizes. An initial goal of the CERES model was to predict leaf number and sizes by quantitatively describing how genetics and climate interact to determine the duration of vegetative growth in cereal crops. This information on LAI would provide the necessary information to more generally predict evaporation and light interception by plants.
The initial step in model development was to estimate duration and rate of crop growth as influenced by the aerial environment and the soil-water status. The next step was to link nitrogen dynamics to the system. The International Fertilizer Development Center was also interested in producing a model with this objective. As a result of that interest an agreement was made for IFDC to jointly develop the nitrogen dynamics routines as an addition to the model. D. C. Godwin was employed to work on that task in collaboration with J.T. Ritchie and C. A. Jones who then worked with the USDA-ARS in Temple, Texas. A nitrogen dynamics model for a maize model (CERES-Maize, Jones and Kiniry, 1986) and for the wheat model (Godwin, 1987) resulted from this effort. Also, to establish credibility for the model on a global scale, S. Otter-Nacke, a post-doctoral fellow from Germany began work on model testing using data sets from throughout the world. A detailed report on that testing effort has also been published (Otter-Nacke et al, 1987).
A multi-federal agency program called AGRISTARS was started in 1979 that provided funding to expand yield modeling. Consequently, Ritchie took on the leadership within USDA-ARS to develop a maize model in addition to the CERES-model. As a result of the AGRISTARS program, developing a user-oriented model for wheat and corn became a full-time objective of the Crop Systems Evaluation Research Unit at Temple, Texas until 1984. In 1984, Ritchie moved to Michigan State University. Since then, further model development and testing has been done there and at IFDC by Godwin.
Because of testing and improvement of the CERES-Wheat model since its beginning in 1977, several different versions of the model have been used for various purposes by several independent groups. Information they provided as feedback regarding model accuracy and user-friendliness, was helpful in improving the model. Two other models have been developed from early versions of the CERES-model as a result of specific interest in wheat modeling. A wheat model called TAMW, was developed by Mass & Arkin, 1980, as part of the Texas A&M University effort at Temple, Texas. The other model called SIMTAG, by Stopper (198xxx) was developed primarily for use in the dry areas in which the International Centre for Agricultural Research in Dry Areas (ICARDA) and the University of New England (Australia) were interested. Both models have much in common with the CERES-Wheat model.
In 1982 the International Benchmark Sites Network for Agrotechnology Transfer (IBSNAT), a USAID funded project at the University of Hawaii, decided to incorporate crop models into its program for international agrotechnology transfer. The CERES-Wheat and -Maize models were among those adopted by IBSNAT as a prototype system. The interest and financial support of IBSNAT has made possible the development of several other cereal crop models similar in detail to the CERES-Wheat and -Maize models. These crops include rice, sorghum, millet, and barley. Also, as a result of the IBSNAT Project, there has been a coordinated development of grain legume models for soybean (SOYGRO), peanut (PNUTGRO), and beans (BEANGRO) at the University of Florida. Present versions of the SOYGRO model (Wilkerson, et al. 1983), the PNUTGRO model (Boote et al., 1987),and BEANGRO have the same input requirements and level of detail as the CERES models thus giving users a wider variety of crop models to use with the same soil and weather input information.
To introduce crop models to a broad range of potential users, IBSNAT has held training workshops in Venezuela, Jordan, Taiwan, Malaysia, India, Bangladesh and Hawaii. These workshops have led several interested individuals to make significant suggestions regarding improvement of the model for technical and user friendliness purposes. In some instances, they have provided excellent data for model testing in various regions of the world.
Many of the ideas used in the model did not originate with the authors nor from technical literature. Several individuals other than those from our own institutions contributed time and expertise to the development of this model. Some collaborators for this project were transferred to Temple during the 1980-84 period by the Economic Research Service (ERS) and the Soil Conservation Service (SCS). Each agency had specific concerns that it wished to have represented in model development. The ERS was interested in resource economic policy questions and the SCS was interested in providing the necessary soil information for use of the model in regions where soil survey information was available. Scientists from the Foreign Agriculture Service, the National Oceanic and Atmospheric Administration (NOAA), and the National Aeronautical and Space Administration (NASA), have collaborated with us and contributed to the usefulness of the model.
At another level, a group of fellow researchers, to whom we are greatly indebted, provided unique contributions to the CERES-Wheat model. The original idea for quantifying the duration of growth stages of the crop as affected by weather and genotype came from H. A. Nix, CSIRO, Canberra, Australia, who provided continued encouragement and technical support throughout the project.
Dr. J. D. Hesketh, USDA-ARS, Urbana, Illinois, assisted with early
experiments conducted at the Duke University Phytotron, and helped to quantify
some of the concepts suggested by Nix. Tom Hodges and his colleagues at NOAA,
in Columbia, Missouri, conducted tests of the model in foreign yield
assessment and published a comparison of the phasic development predictions of
CERES-Wheat with other models (Hodges, et al.,198xxx). Greg Larson, USDA-SRS,
published the results of a sensitivity analysis of an earlier version of the
CERES-Wheat model (Larson et al., 198xxx). The analysis provided feed-back
for making several model improvements.
PURPOSE
The CERES-Wheat model was designed to simulate the effects of cultivar, planting density, weather, soil water, and nitrogen on crop growth, development, and yield. It was developed to be useful for prediction and control at the farm and regional level. These objectives partially dictated the level of detail of the model. The model is not principally intended to be an explanatory model for improving understanding of how the crop system works. The primary purpose is for predicting potential alternative management strategies and tactics that affect yield and intermediate steps in the yield formation process. It is also intended to be useful at the farm level for within year crop decision making and
multiyear analysis for risk assessment. On a regional basis it is intended to be useful for yield forecasting and the analysis of various policy questions related to crop production and resource conservation.
These purposes require that the model have the following characteristics:
o Use readily available weather, soil, and genetic inputs.
o Be written in a familiar and widely used computer language.
o Require minimal computation time.
o Be useful on microcomputers.
As a result of these constraints, most input data are available from or can be readily estimated from routinely collected daily weather data, standard soil characterization data, and data provided in the model documentation. The computer program is written in the familiar scientific language, FORTRAN.
To accurately simulate maize growth, development, and yield, the model takes into account the following processes:
o Phenological development, especially as it is affected by genetics and weather.
o Extension growth of leaves, stems, and roots.
o Biomass accumulation and partitioning, especially reproductive organs.
o Soil water balance and water use by the crop.
o Soil nitrogen transformations, uptake by the crop, and partitioning among plant parts.
A final purpose for the model is to identify knowledge gaps that can
lead to improvements in the model's predictive capacity. Some of the gaps are
highlighted in Chapter 9.
SYSTEM BOUNDARIES
To accomplish the primary purposes outlined above, it was necessary to
exclude several potentially important factors that influence yield. The model
focuses on how weather and genetic characteristics affect potential yield
given a specified management scheme. Factors associated with management and
weather however, are limited to plant-water supply and plant-nitrogen supply.
We excluded phosphorous, potassium and other essential plant nutrients on the
basis that they are often found in sufficient supply such that plant growth is
not limited by them. Also, for the model to be more realistic, it should
include linkages with pests and toxicities of various kinds. This model
excludes those things as well as soil salinity and soil aeration problems.
Catastrophic weather events such as hurricanes, hail storms or typhoons are
not considered nor are yield reductions due to crop lodging. Many of these
items could be incorporated into the model as a sub-routine if the need for
that detail becomes warranted. Scientists from IFDC are planning a phosphorus
linkage. Several pest management specialists are planning to link specific
pest models with CERES-Wheat and other models adopted in the IBSNAT program.
Published examples coupling pests to the IBSNAT crop models for predicting
reduction in yield already exist (Berger and Jones, 1985; Boote, et al, 1983)
although model tests have not yet been reported.
PHILOSOPHY REGARDING THE LEVEL OF DETAIL
The CERES-Wheat model was developed to include information from several scientific disciplines. To do this, maintaining balance in the entire model became our foremost principle. The predictions of the model can be no better than the level of detail of the least understood part of the model. It can not be made more accurate by including information from disciplines which are much better understood. Maintaining balance is somewhat similar to significant digits retained in mathematical functions. If a number with seven significant digits is multiplied by a number with two significant digits, the product is no better than the two significant digit number.
To maintain balance, it seemed clear to us that crop biomass growth needed to be calculated independently of the plant development. Biomass growth has been the focal point of many comprehensive crop models which have been developed to date. Our philosophy is that development and growth had to be treated in balance for the model to produce realistic predictions because each factor is affected by the environment and stresses in different ways.
Realistic model prediction also depends on accurate input information.
Model inputs of soils and weather that are potentially spatially variable
limit the ability to accurately predict the spatially variable area. The
important inputs that usually are spatially variable include depth of
effective rooting in the soil and rainfall amounts measured with a rain gauge
that is often located some distance from the field. Variation in rooting
depth is difficult to measure but influences the supply of water and nutrients
for the plants. When water and nutrient supplies are marginal, spatial
variability in plant size is often observed within fairly small areas of a
field. This creates a degree of uncertainty in model predictions that must be
considered when deciding on the level of detail to be used.
THE NEED FOR USER-ORIENTED MODELS
With declining profitability and natural resources becoming more scarce, farm managers and regional policy planners require new tools to assist in decision making. Simulation models that can capture the major edaphic and genetic effects on crop growth as well as the nuances of weather offer good opportunities for assisting farm managers in several aspects of decision making.
Farmers make decisions that are surrounded by natural and economic uncertainties, mainly weather and prices. Agricultural research is designed to provide information that will help the farmer in making such decisions. It is almost impossible, however, for research to provide specific answers, because field experiments cannot include all possible soil types and weather sequences.
Many farmers make decisions based on the condition of the crops. Experience guides their decisions. However, a complete understanding of the impact of any decision is unknown, including the economic aspect. Combinations of weather, pests, and economic uncertainties are so numerous that it would be difficult for any person to gain sufficient experience to enable them to minimize risk in their decision making. Agricultural experimental information, such as yield response to fertilizer rates, when conducted over a several-year period at a site, usually provides the kind of information needed by professional agriculturalists who help farmers make decisions. When mean response to experiments having multiple-year and multiple levels of factors is obtained, a simple economic analysis can provide a recommended practice, given the price of output and the cost of the input. Optimum practices calculated from mean responses, however, only apply to farmers who take no account of risk. Farmers are not risk neutral. They seek goals such as (1) maximum profit or cash flow, (2) minimum variance of yield, (3) maximum stability of income, (4) minimum environmental degradation such as soil erosion and loss of nutrients or harmful chemicals to ground or surface water, and (5) some combination of the above. Crop models that use specific weather, soils, genetic, and management information can assist in evaluating strategies needed to attain farmers' goals.
Regional policy decisions related to agriculture involve maintenance of
an adequate supply and quality of water for domestic and industrial
consumption and a general conservation of natural resources for a region.
Because agriculture is usually the major user of the water of a region, and
large quantities and diversities of chemicals are applied to the land, making
rational decisions regarding the impact of agricultural practices on the
nonagricultural segment of society is becoming increasingly important.
Because of the spatial variation in soil properties of a region and the
temporal variation in weather, the use of crop models, in addition to models
of other parts of the agricultural system, make the supportive decisions more
rational. To establish credibility for predictions of the region however,
monitoring activities will be needed at carefully selected sites to
demonstrate that models predict reasonably well at those sites. Chapter 10
includes some possibilities regarding application of the model to problem
solving and decision making.
OVERVIEW OF MODEL OPERATIONS
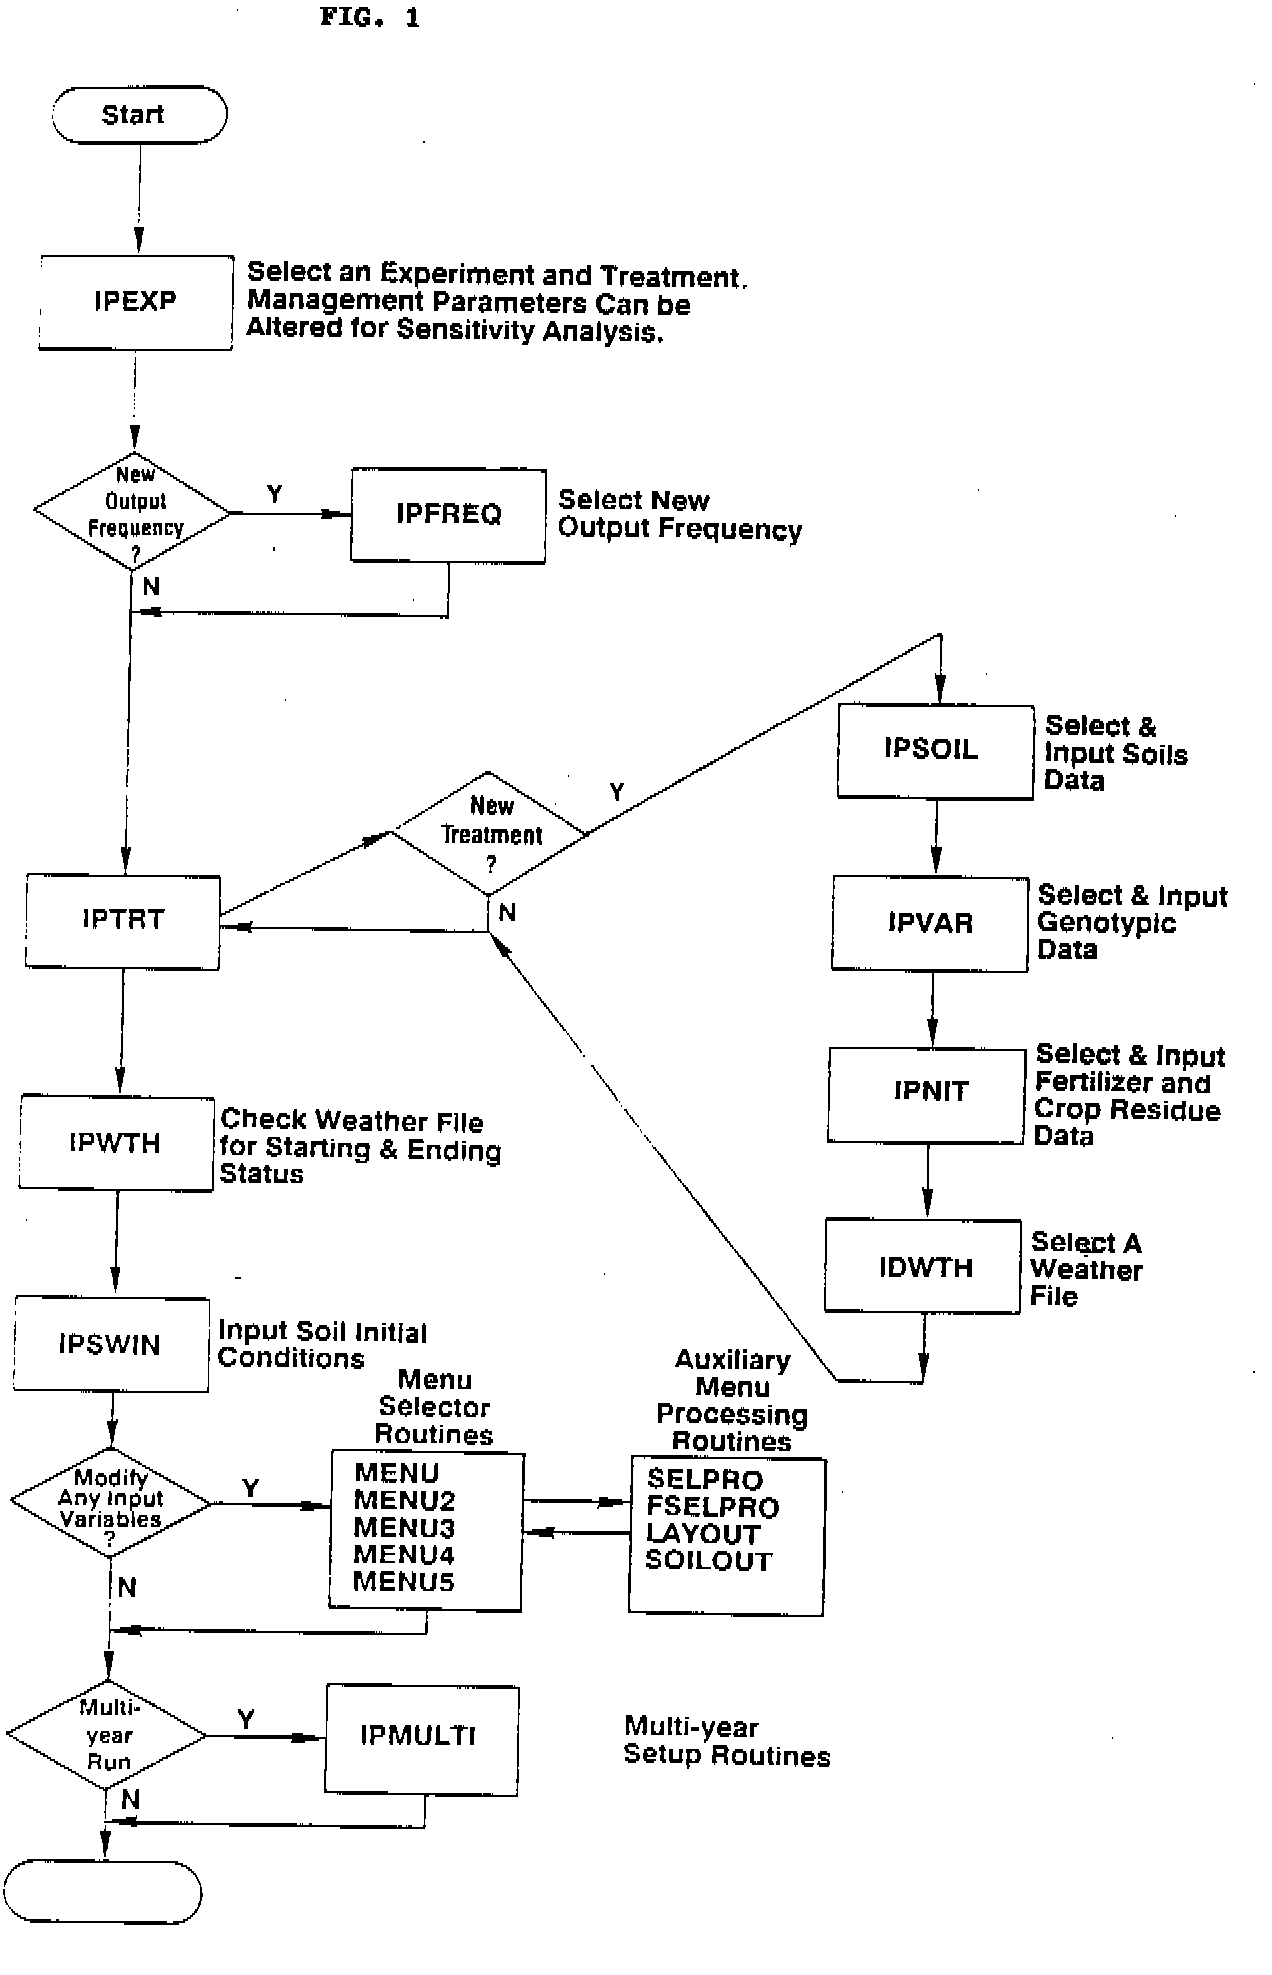
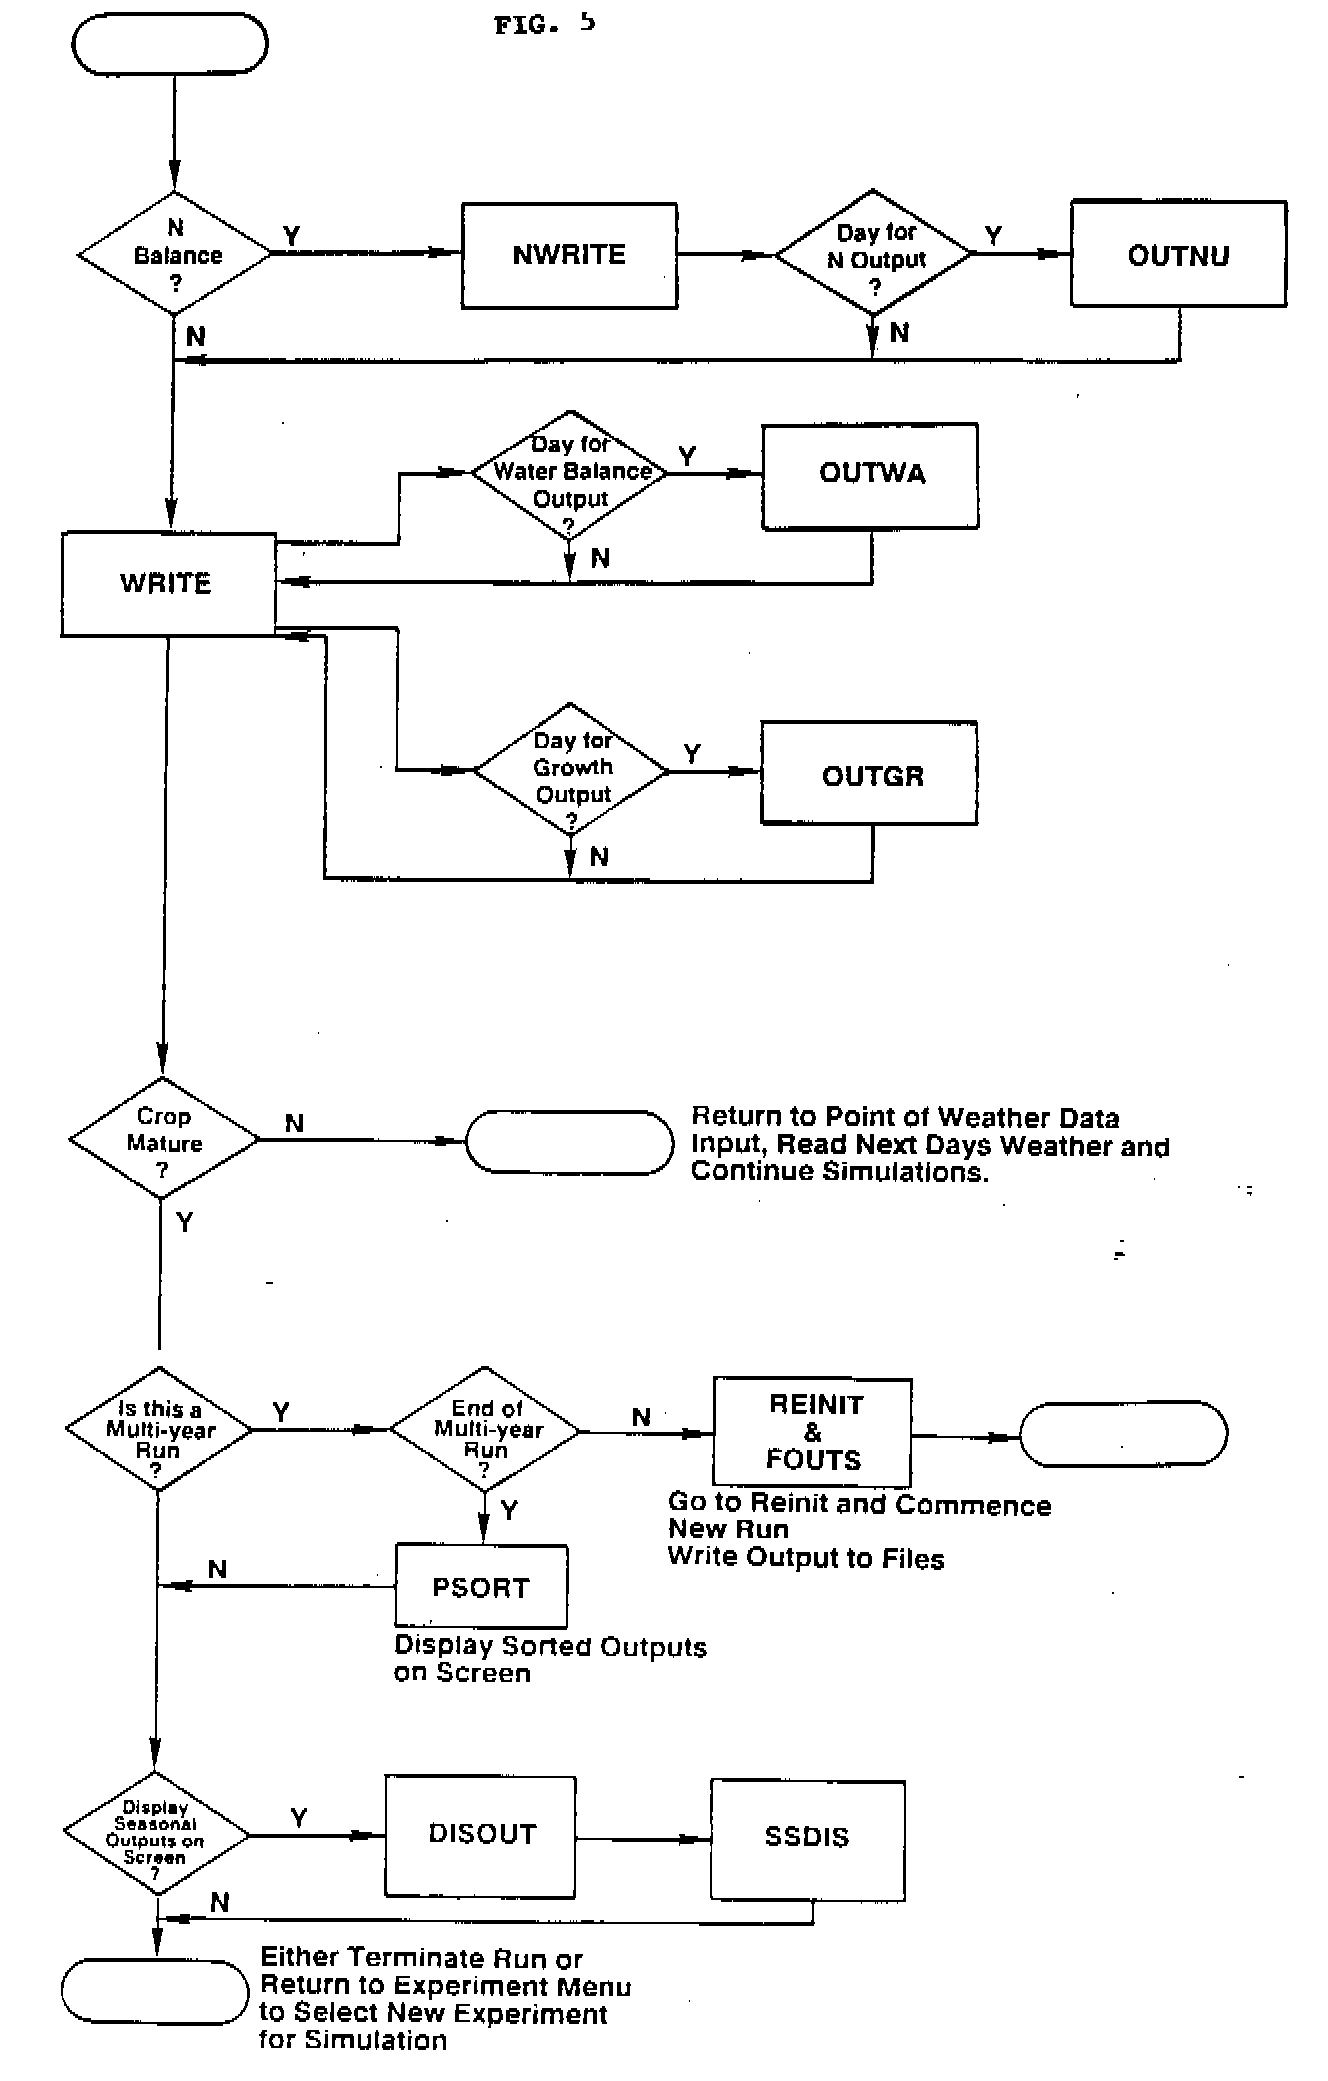
The model consists of a series of subroutines with a separate subroutine for each major process. In addition to this, there are subroutines associated with input and output and of the user-friendly interface. The names and functions of each of these subroutines and the interlinkages between them are indicated in the flowcharts shown in Fig. 1-5. The model uses a standardized system for model inputs and outputs that have been mutually agreed upon for the IBSNAT project (IBSNAT, 1986). The input system enables the user to interactively select crop genotypic, weather, soil, and management data appropriate to the experiment being simulated. Figure 1 flowcharts this selection process. The structure and format of all required model inputs is described in Chapter 5.
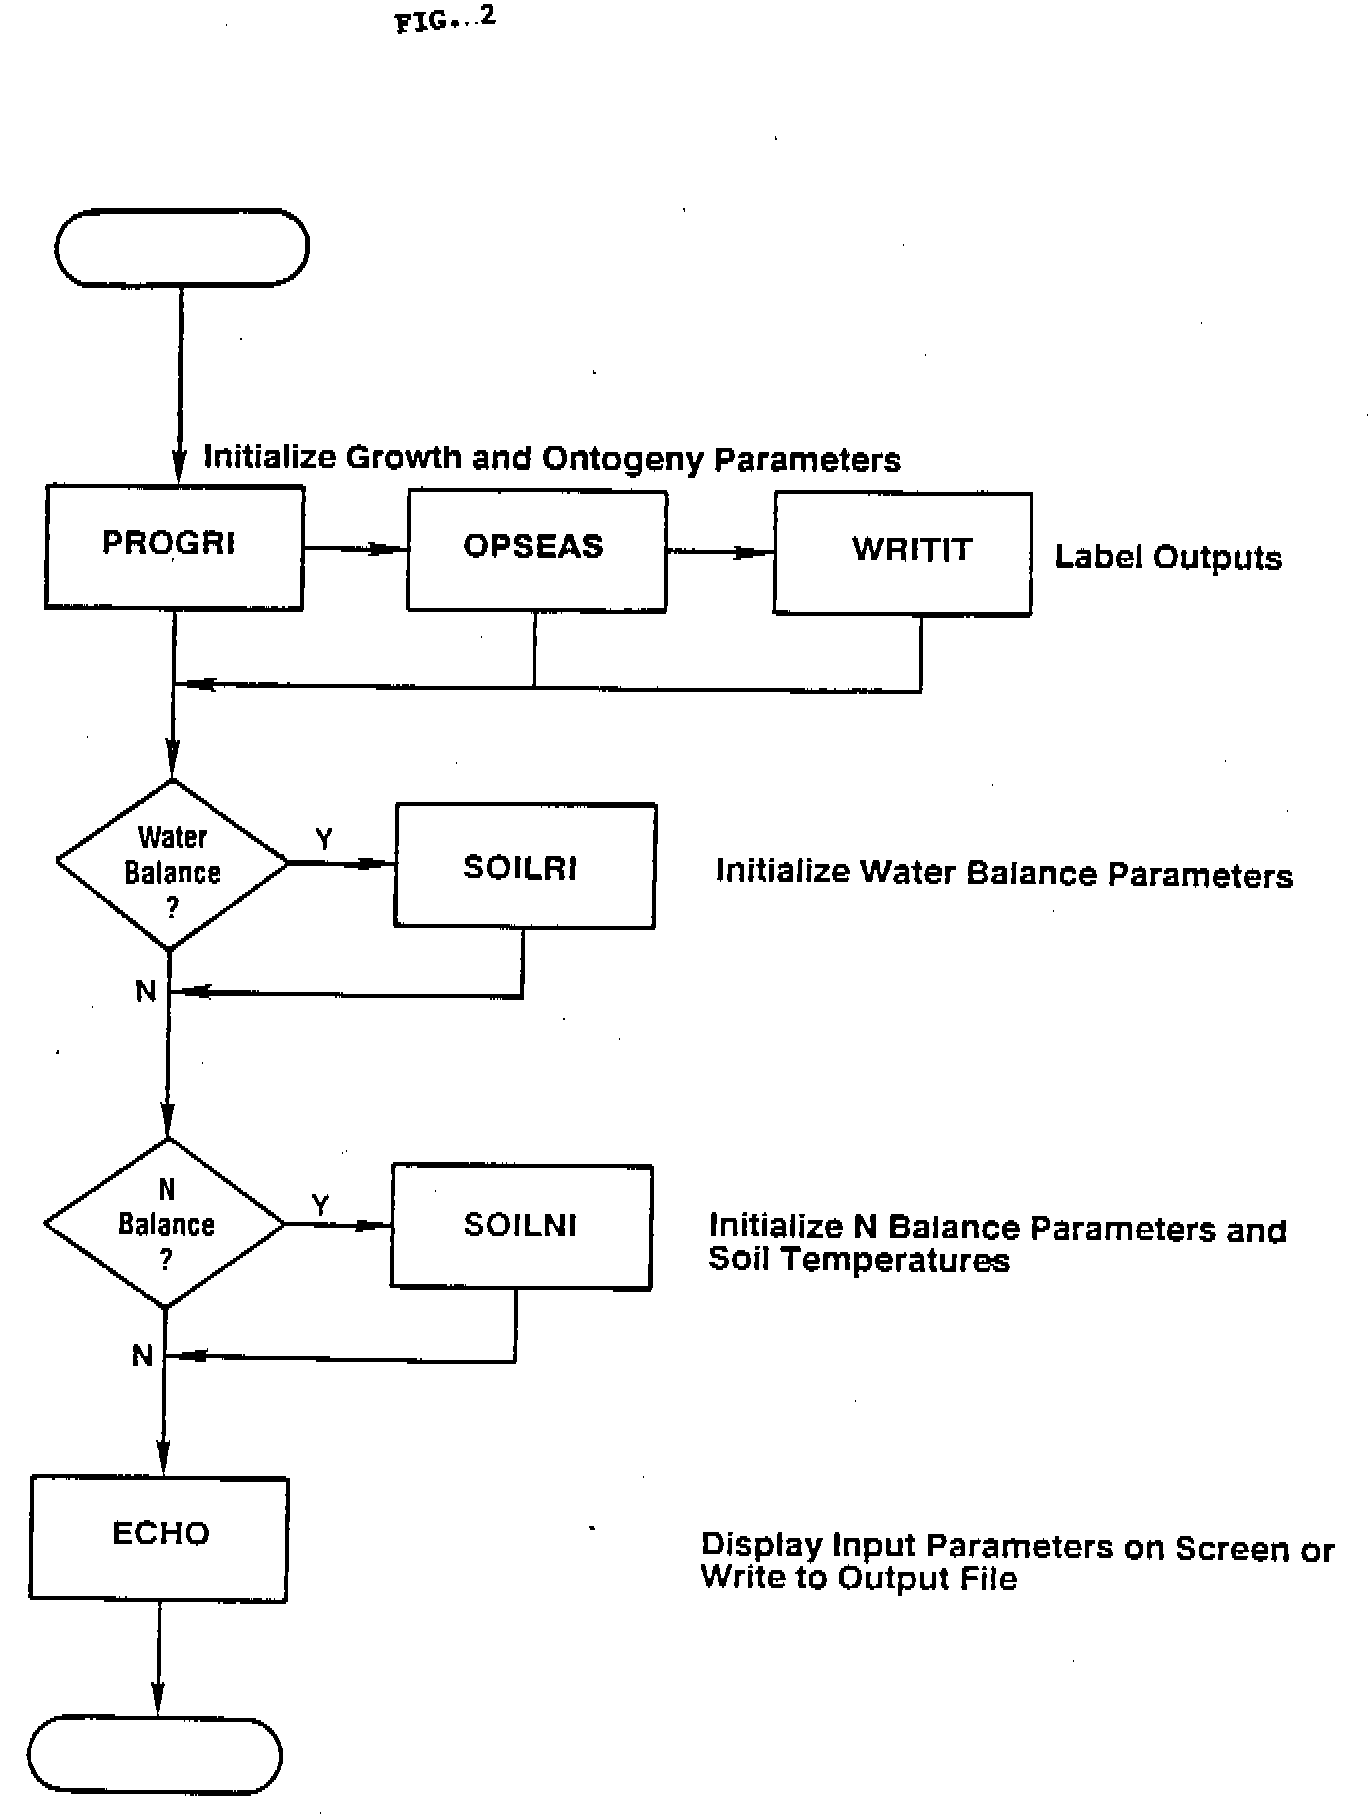
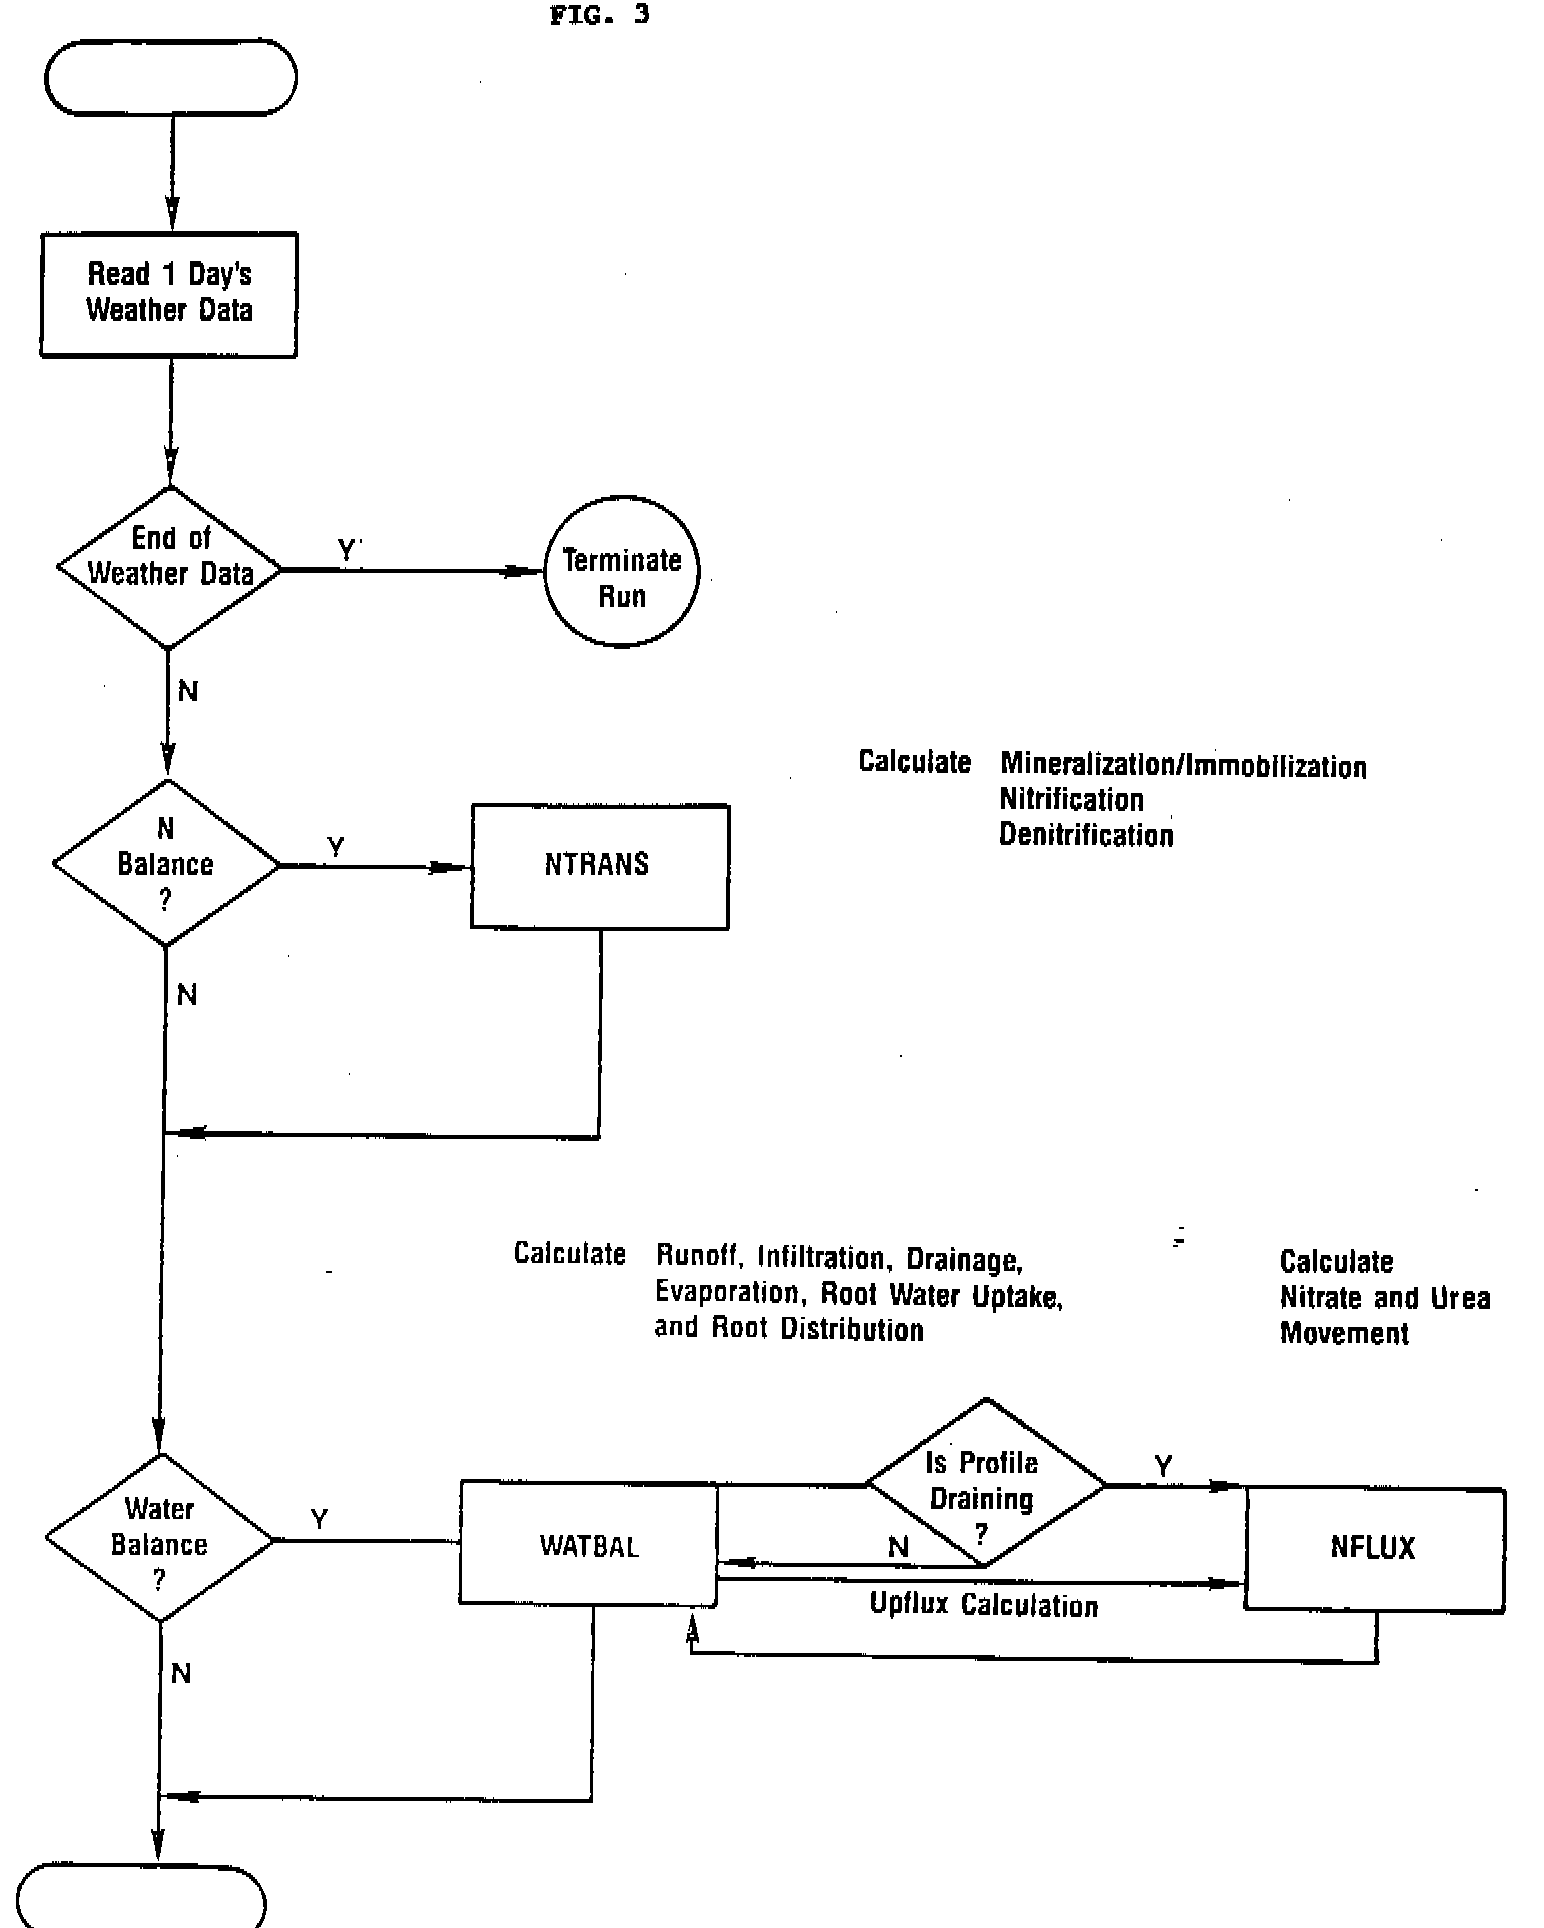
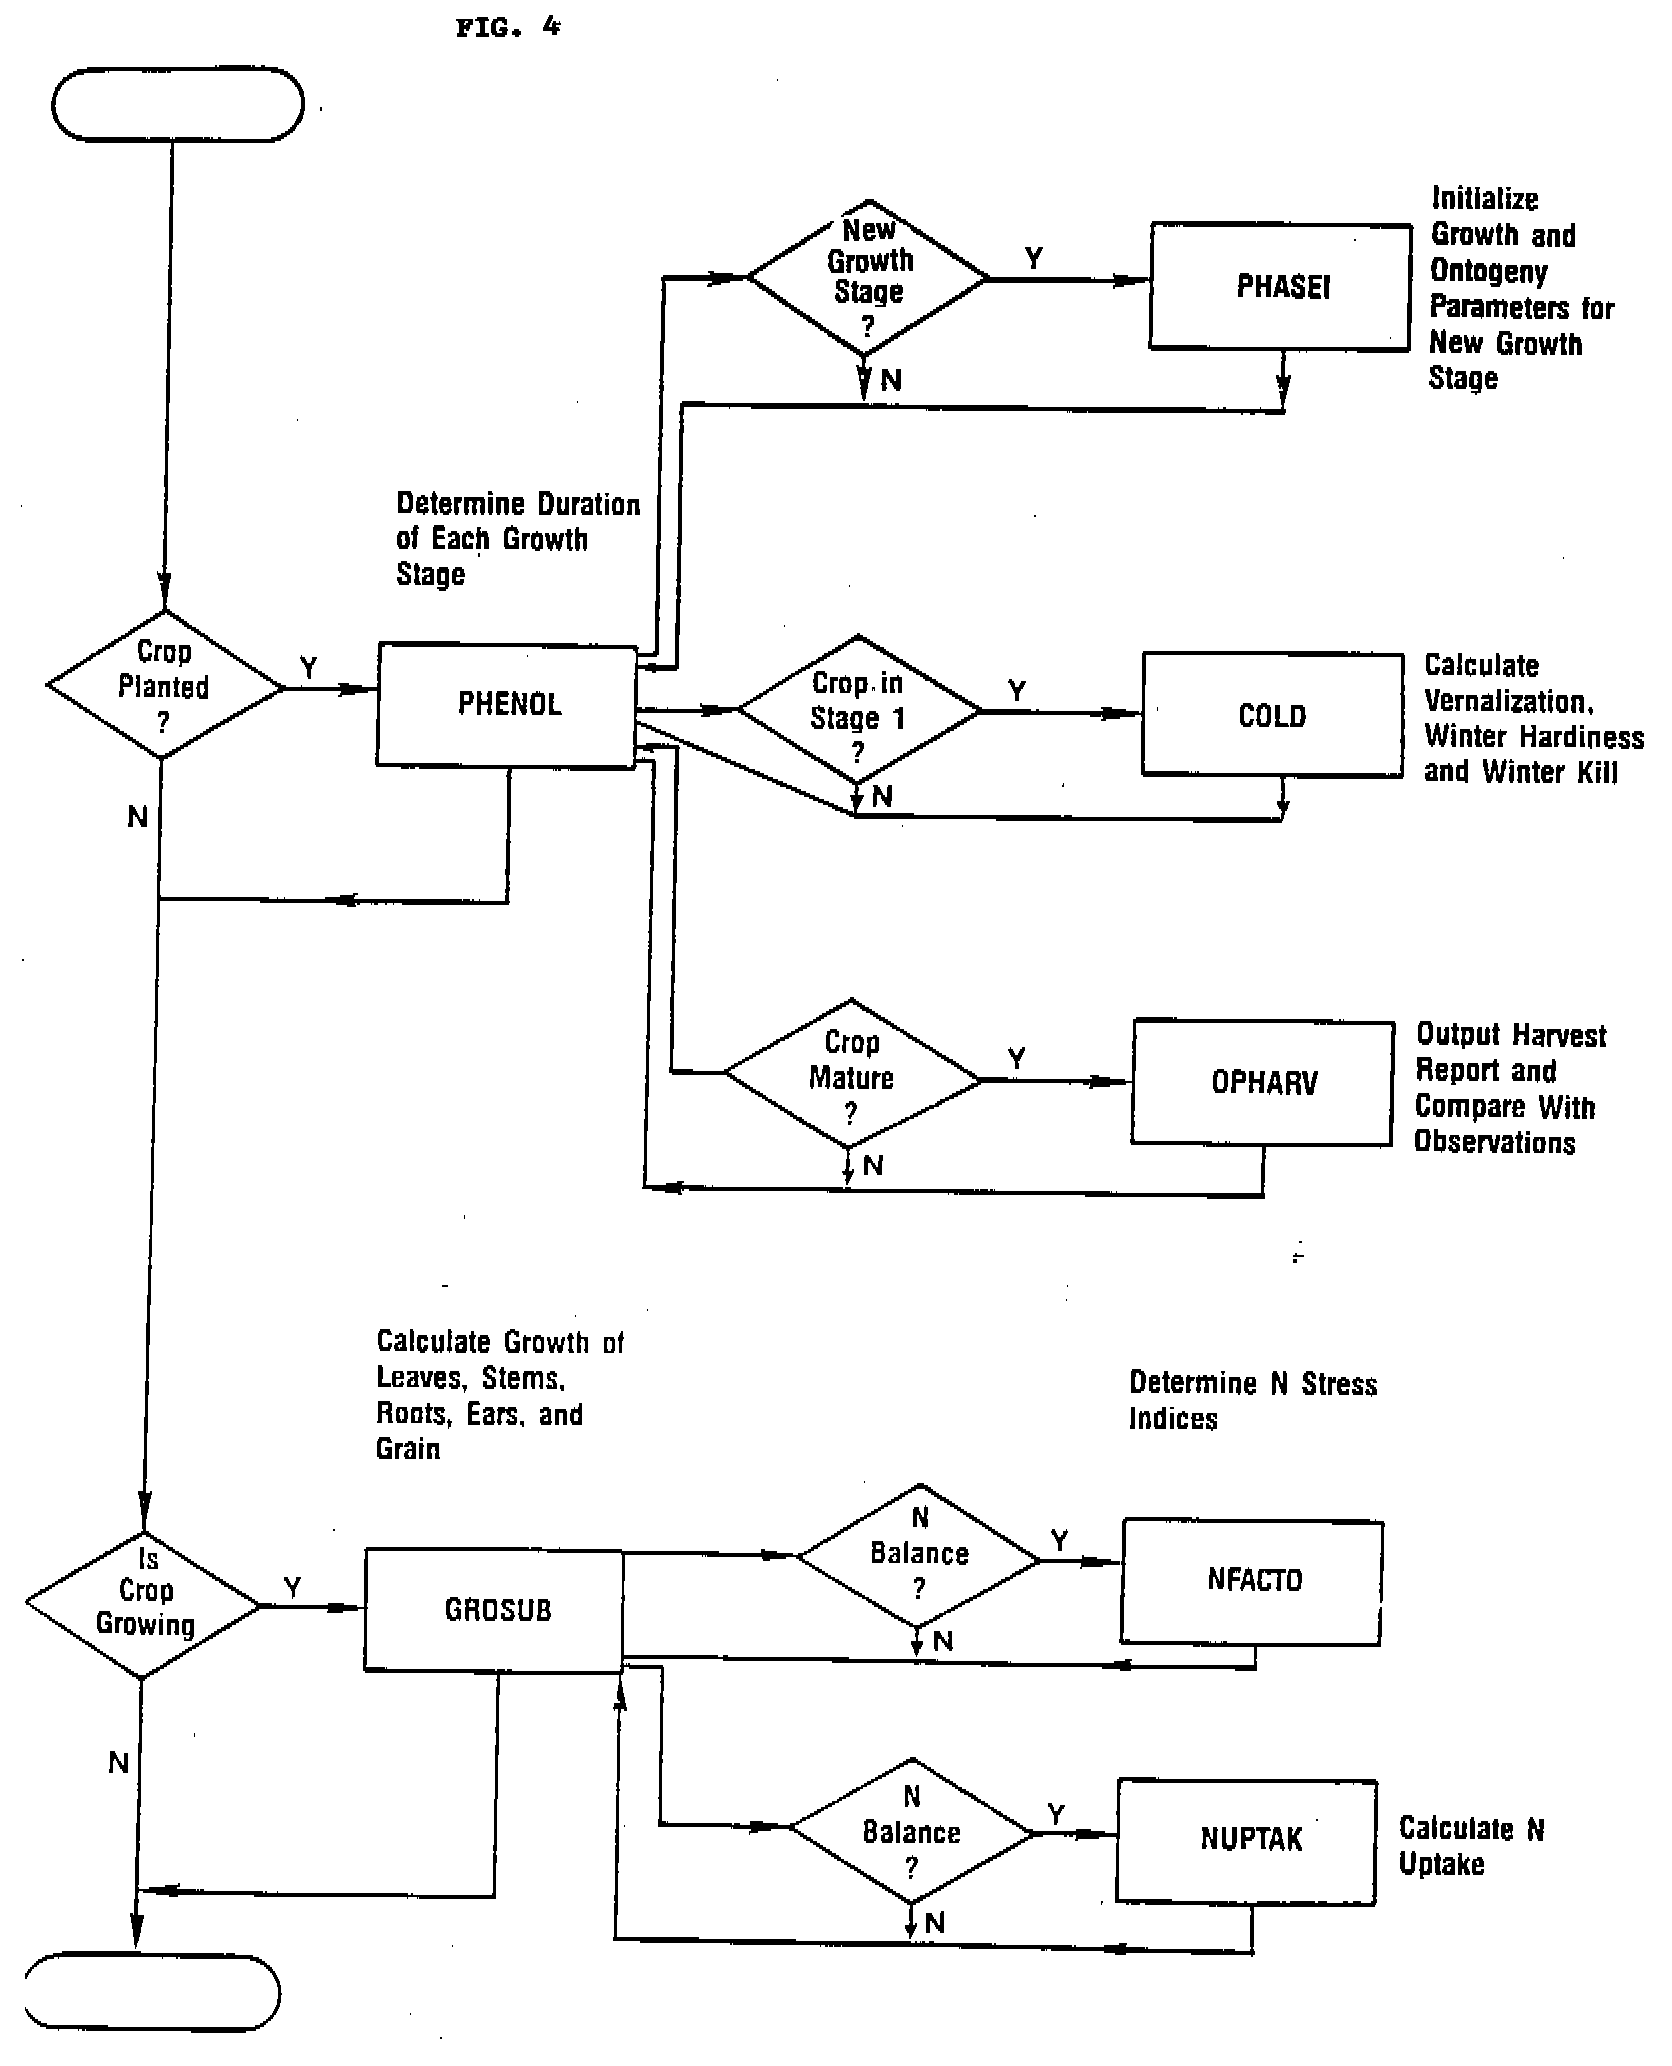
After selection of the appropriate inputs, the model initializes the necessary variables for growth, water balance, and soil nitrogen dynamics simulation, and displays these parameters for checking before commencing simulation. These initializations are accomplished in the subroutines depicted in Fig. 2. The model uses two switches that are provided as input parameters. One of these enables the model to be run with the assumption that N is nonlimiting and thus none of the N transformation calculations are computed. The second switch enables the model to be run with the assumption that water is nonlimiting and thus water balance calculations are not performed. These options can reduce input requirements and execution time ubstantially. Following initializations, a daily simulation loop is entered in which one day's weather data is read and then all calculations on water and N balance, crop growth, and development are performed (Fig. 3 and 4). A series of switches is used to route execution to different subroutines dependent upon the stage of development of the crop and whether the soil profile is draining. After these calculations are completed, output may be written to the output files (Fig. 5). The simulation continues by returning control to the point of reading the next day's weather data.
The model can be run in three modes:
1. Single treatment simulation. This is the most common form where the inputs are displayed on the screen, the model works through the daily simulation, and then a bale showing a comparison of predicted and observed values is displayed.
2. Multiple treatment simulation. All treatments in an experiment can be simulated without requiring further inputs from the keyboard to answer the various prompts. At the end of the run all the outputs can be printed or displayed on the screen for closer examination.
3. Multiple-year run. This option is intended for cases where on wishes to examine the year-to-year variability in outcomes of a particular management strategy. For these cases outputs can be selected that provide only a single line summary for each crop season of simulation. Since all other output is bypassed, this form of model operation is the fastest.
Details on using the model are provided in Chapter 7.
|
|
|---|