PHASIC DEVELOPMENT
The simulation of crop yield focuses around three important areas: growth duration, growth rate and the extent to which "stresses" influence these two processes. Stress can take the form of deficiencies of soil water and nutrients or extremes in temperature. The soil related deficiencies are discussed in Chapters 3 and 4. Growth duration is extremely important in the determination of potential crop yields. In general, the longer the growth duration for the crop, the higher the yield potential. In wheat, this is especially true for the period from the time the stem and inflorescence start to grow until the end of grain filling. The duration of different growth phases is referred to as phasic development. Phasic development is affected primarily by genetic and environmental factors. The genetic diversity of wheat sensitivity to photoperiod and vernalization has allowed plant breeders to select wheat cultivars that can produce grain in environments as far north as Alaska to as far south as southern Argentina and on most arable land in between where the supply of water is adequate. Because wheat has been a relatively low value crop during most of this century, it is often grown under rainfed conditions where precipitation is marginal for part or all of the season. In such instances, cultivars have to be developed that complete their life cycle soon enough to avoid complete crop failure. Because of this genetic diversity, and the diversity of regions where wheat is grown, we thought it would be essential to include quantitative aspects of phasic development in the model for it to be useful for many applications.
The CERES model separately calculates phasic development to drive the model through time. It calculates the appearance and number of leaves on the main stem, the number of tillers and the number of grains on a plant. These aspects are referred to as plant morphological development and they are calculated separately although they are closely coupled with phasic development and plant growth. Expansion growth of leaves and stems are calculated separately from mass growth because expansion growth is considered as a "sink" that is driven primarily by temperature of the expanding tissue. Mass growth is considered to be the "source" necessary to fill the expanding tissue and also provide assimilate to the root system for expansion and maintenance. Mass growth, however, is driven primarily by radiation interception by plant leaves.
By separately evaluating these four aspects of plant development and growth, the logic for partitioning assimilates into different plant parts can be accommodated according to several principles established in scientific literature. Some of the major principles include:
o During the grain filling period, the grains are the dominant sink for assimilates. Material for filling the grains can be derived from current photosynthesis and stored assimilates. Deficiencies of water and nutrients have little affect on the ability of material to be transported to the grain.
o During vegetative growth, shoots have a higher priority than roots for assimilates so long as the supply of water and nutrients from the soil is adequate. When water or nutrients are limited during vegetative growth, roots have a higher priority than shoots.
The part of the CERES model described in this chapter uses the above general principles of partitioning during different phases of development to predict the growth of a plant from a seed with particular important genetic characteristics through the many seeds at crop maturity.
The CERES-Wheat model was developed to estimate the duration of the growth cycle of different genetic types of wheat used throughout the world. The duration of crop growth without disease, water, or pest stress is often the major determinant of crop yield potential. The relationship between biomass yield and grain yield somewhat depends on genotype, but yield is usually proportional to the above-ground biomass. Improvements in crop yield in regions of the world that have the same duration of crop growth have come mainly from improving the harvest index, i.e. the ratio of grain yield to biomass.
The major factor limiting the development of crop models for use worldwide has been in determining how the genotype of a particular crop is related to the duration of crop growth and environmental stresses. Within any particular region of the world, crops are selected as to their ability to fit the environmental conditions of the region where they will be grown. Such adaptability relies on genetic factors, such as the ability to utilize available water, cold hardiness, and the susceptibility to winterkill. A crop model, therefore, needs to quantify the interaction between genetic type and the environment.
Phasic development in CERES-Wheat deals with the duration of growth stages. The growth stages of wheat are organized around the plant's life cycle when changes occur in the partitioning of assimilate among the different plant organs. For example, prior to terminal spikelet formation, practically all assimilate is partitioned between the leaves and the roots. After terminal spikelet formation, stems begin to require assimilate and the ear later becomes a major site for assimilate.
In CERES-Wheat, the growth stages of wheat are numbered from 1 through 9 (Table 1).
Stages 1 through 5 are the active above-ground growing stages; stages 6 through 9 describe other
important events in the crop cycle.
PHASIC DEVELOPMENT CONTROL
Both genotype and environment influence phasic development in CERES-Wheat. Prior to germination (Stage 9), the primary variable influencing the development rate is the soil-water environment. After
germination, the primary variable influencing the rate of development is temperature.
Table 1. Growth Stages of Wheat as Defined in CERES-Wheat
| Stage | Event | Plant Parts Growing |
| 7 | Fallow or presowing | - |
| 8 | Sowing to germination | - |
| 9 | Germination to emergence | Roots, coleoptile |
| 1 | Emergence to terminal spikelet initiation | Roots, leaves |
| 2 | Terminal spikelet to end of leaf growth and beginning of ear growth | Roots, leaves, stems |
| 3 | End of leaf growth and beginning of ear growth to end of pre-anthesis ear growth | Roots, leaves, ear |
| 4 | End of pre-anthesis ear growth to beginning of grain filling | Roots, stems |
| 5 | Grain filling | Roots, stems, grain |
| 6 | End of grain filling to harvest | - |
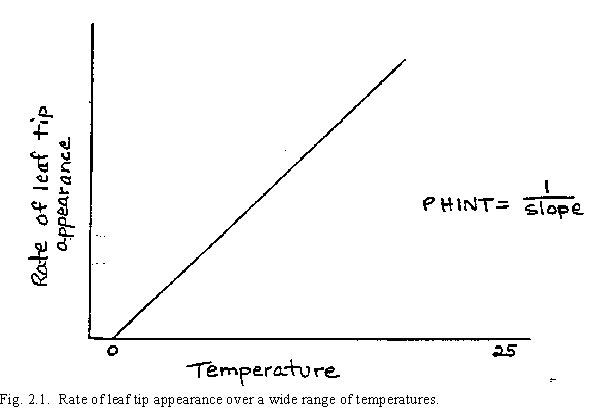
After germination and until emergence (Stage 9), development rates are controlled by temperature. Here it is assumed that development rates are directly proportional to temperature in the range from the base temperature (0oC) to a maximum temperature of 26oC. The use of OoC as a base temperature, rather than the other base temperatures near 0oC that have sometimes been suggested, is the result from work measuring the rate of leaf appearance under controlled temperature environments. By plotting the rate of leaf tip appearance versus temperature, a near linear relationship is obtained. Fig. 2.1 demonstrates this graphically, as used in CERES-Wheat, over a wide temperature range. Extrapolating this line to a zero rate of leaf appearance intersects the temperature axis at or near 0oC. Thus daily temperature above 0oC is accumulated and referred to as thermal time (Gallagher 1979).

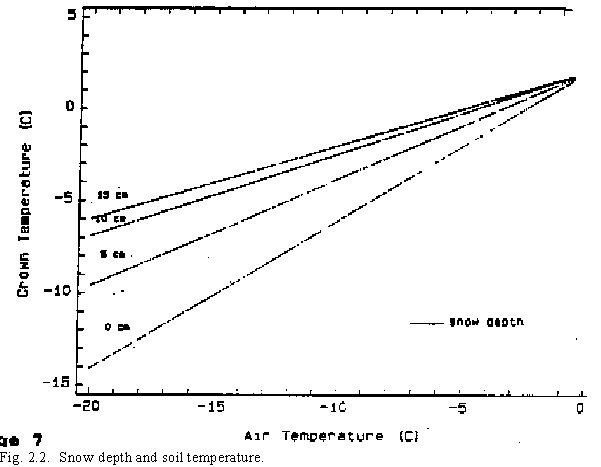
When the daily minimum temperature is above 0oC and the maximum is below 26oC, thermal time for a day is assumed to be the mean of the maximum and minimum values. The air mean temperature is considered to be equal to the mean temperature of the plant crown where plant expansion growth is occurring. While this assumption is subject to error for diurnal temperature variation, these errors usually cancel one another when longer period averages are used. When mean air temperatures are less than 0oC for long periods, i.e. frozen soils, the plant crown temperature is higher than the air temperature due to heat retained in the soil. When this condition occurs, a separate thermal time calculation is made. Calculating thermal time at low temperatures is especially important to determine plant hardening and freeze killing since development does not occur at temperatures less than 0oC. Snow depth also influences plant hardening and freeze killing. The insulating effect of snow at air temperatures less than 0oC raises the temperature of the plant crown higher than the air temperature--the magnitude depends on the actual snow depth(1) (Fig. 2.2).
Stage 7
Stage 7, fallow or presowing, is used to model the soil-water balance during fallow periods and is useful when the initial soil-water condition at sowing is unknown. If the initial soil-water content at
sowing is known, there is no need to run the water balance in a presowing
fallow period. If the water balance is run during the presowing period, the soil-water content can
often be assumed to be either uniformly dry when the previous crop was harvested, or uniformly wet
on some date following sufficient rainfall to reasonably assume wet conditions. Of course, the model
requires weather information during Stage 7 runs.
Stage 8
Seed germination is a rapid process and is assumed to occur in one day unless the soil water
content in the top layer is near the lower limit or if the temperature is below 0oC. Under most
conditions, seed would not be sown in cold soil. Seed is, however, sometimes sown in dry soil and
is not expected to germinate until the soil is wet.
Stage 9
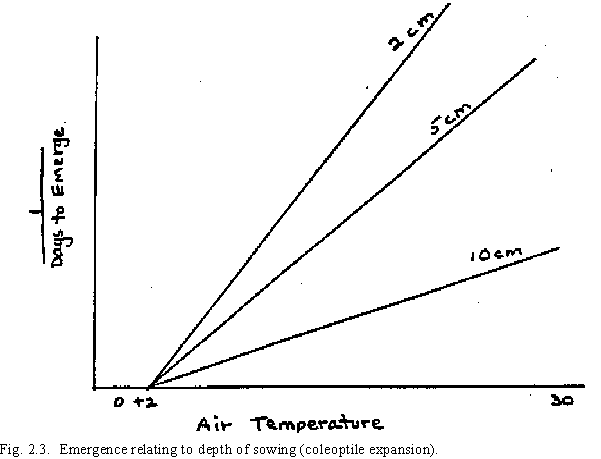
Temperature and the depth of sowing are two constraints affecting seedling emergence. The soil water condition is not considered in emergence because it is assumed that if the soil water content is sufficient for germination, it is sufficient for emergence. Temperature affects emergence in the accumulation of thermal time. The affect of the depth of sowing on plant emergence is through the length of time necessary for coleoptile expansion to the surface (Fig. 2.3). The duration of Stage 9, (P9), is expressed by
where P9 is the thermal time for Stage 9 and SDEPTH is the depth of sowing in centimeters, an input in the model.
Stage 1
Vernalization. The thermal time for all growth stages is not fixed. Vernalization, photoperiod, and genetic characteristics cause the total thermal time from, emergence to terminal spikelet, to vary considerably. Two factors determining the length of the vegetative phase of growth are leaf appearance, based only on the thermal time per leaf (PHINT), and initiation of flowering, based on vernalization and photoperiod.
Winter wheat varieties usually require exposure to relatively low temperatures before spikelet formation can begin. This low temperature requirement for flowering, called vernalization, begins at germination.
Our own phytotron work, in addition to work by others, suggests that vernalization occurs at temperatures between 0 and 15oC. The optimum temperature for vernalization is assumed to be in the range of 0oC to 7oC, with temperatures between 7oC and 15oC having a decreasing influence on vernalization. Minimum and maximum daily temperatures are used to calculate a daily vernalization effectiveness factor with a value between 0 and 1 (Fig. 2.4). The relative vernalization effectiveness factor (RVE) is then accumulated to determine the duration of effective vernalization, or vernalization days. Vernalization days is the summation of daily RVE values. Even though there is genetic variability in sensitivity to vernalization between cultivars, fifty vernalization days are considered to be sufficient to completely vernalize all cultivars (Table 2, Fig. 2.5). The genetic variability in sensitivity to vernalization is considered by the use of a genetic specific coefficient (P1V) to calculate the influence of vernalization on Stage 1 growth. Spring wheat varieties, which have a low sensitivity to vernalization, thus can be incorporated in the CERES-Wheat model the same as winter wheat varieties by expressing the differences in vernalization through the input coefficient P1V.
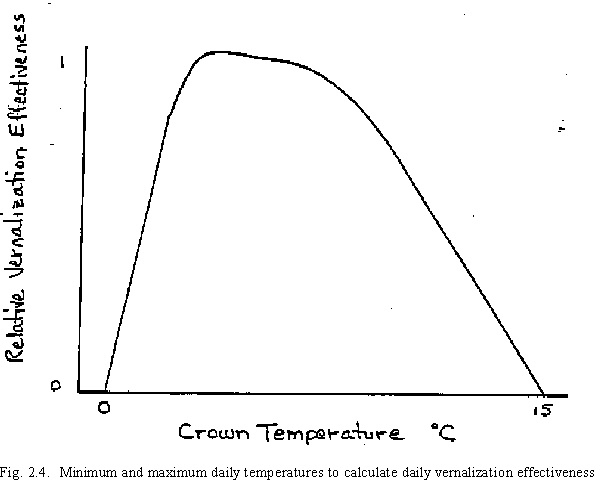
Table 2. Results of a study performed to determine coefficients for 12 varieties: values of vernalization constant (k) [RDR = 1 - k(50 - V)].
| Variety | k x 10-2 |
| Agent | 0.5 |
| Lancota | 1.4 |
| Centurk | 2.6 |
| Sage | 2.7 |
| Scout 66 | 2.9 |
| Sturdy | 3.0 |
| Nugaines | 3.0 |
| Triumph | 3.1 |
| Bezastaya | 3.1 |
| Coker 68-15 | 3.1 |
| Arthur 71 | 3.2 |
| Pawnee | 4.0 |
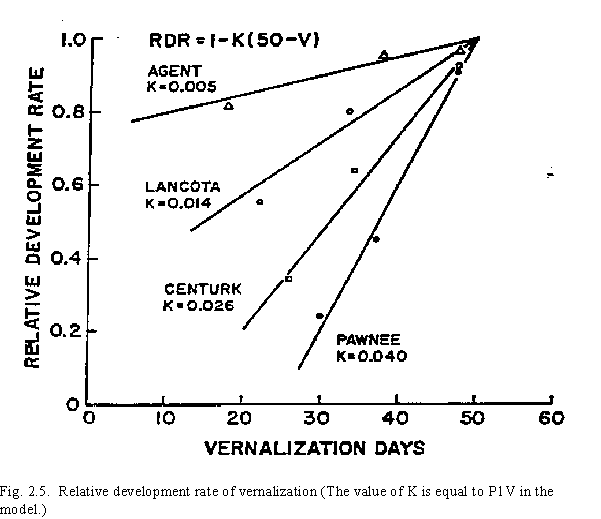
Devernalization can occur when young seedlings are exposed to high temperature. In the model, if the number of vernalization days (CUMVD) is less than 10 and the maximum temperature exceeds 30oC, then the number of vernalization days decreases by 0.5 days per degree above 30oC. If CUMVD is greater than 10, no devernalization is calculated.
A short photoperiod can delay Stage 1 plant development. In CERES-Wheat, day lengths shorter than 20 hours can delay phasic development. The delay depends on the photoperiod sensitivity of the variety being used, which is expressed in a genetic specific characteristic (P1D) (Table 3, Fig. 2.6). In the model, calculated photoperiods include civil twilight. Latitude, a required input, and the time of year are used for this calculation.
Table 3. Results of a study performed to determine coefficients for 12 variables: values of photoperiod constant (C) [RDR = 1 - C(20-P)2].
| Variety | C x 10-3 |
| Sturdy | 2.1 |
| Coker 68-15 | 2.6 |
| Bezastaya | 3.2 |
| Arthur 71 | 3.4 |
| Centurk | 3.7 |
| Triump | 3.9 |
| Lancota | 4.0 |
| Nugaines | 4.4 |
| Scout 66 | 4.9 |
| Pawnee | 5.2 |
| Sage | 5.5 |
| Agent | 6.0 |
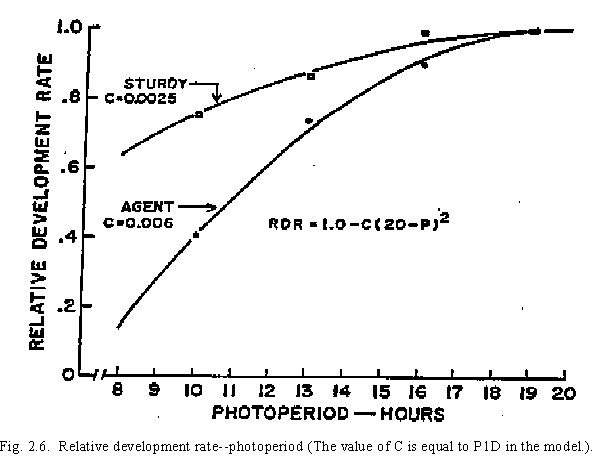
Vernalization days and photoperiod are used to modify the accumulation of thermal time in Stage 1. Vernalization and photoperiod factors with values between 0 and 1, VF and DF, respectively, are calculated using the P1V and P1D coefficients. The minimum value of VF and DF is then multiplied by the thermal time to reduce rate of thermal time accumulation. When this reduced thermal time accumulation (TDU) reaches 400 degree days, Stage 1 development ends.

where TDU = thermal development units, and DTT = daily thermal time.
PHINT. In determining the vegetative development of wheat, it is necessary to define a term related to leaf appearance, the phyllochron. A phyllochron is defined herein as the interval of time between leaf tip appearance; in the CERES-Wheat model it is the variable PHINT. A phyllochron was assumed to be a constant number of degree days in earlier versions of the model. However, tests of models on a global scale have shown that some apparent environmental stimulus in addition to temperature causes the interval
between leaf appearance to vary. In England, winter wheat sown in the autumn has a considerably longer phyllochron (100 degree days) than spring-sown winter wheat, (75 degree days) as reported by Baker et al. 1980. The explained this phenomenon on the basis of the range of change in photoperiod. In North Dakota, wheat sown in late spring has relatively short phyllochrons, usually ranging around 75 degree days (A. Bauer, pers. comm.). Causes of this phenomenon, however, are not clearly understood and our own efforts at reproducing the effect in controlled climate chambers have
mostly failed. This, therefore, creates a degree of uncertainty in models, making an accurate prediction of crop duration difficult unless the PHINT value is known. If the sowing date for a crop is about the same time each year, the PHINT value should be constant from year to year.
The PHINT value can be measured by determining the date of appearance of leaf tips on the
main stem for several plants and graphing the cumulative number of leaf tips on the Y axis against
the cumulative thermal time on the X axis. The inverse of the slope of this line is the value
appropriate for PHINT (see Fig. 2.7). When direct measurements of the input value of PHINT are
not available, a good estimate for PHINT is 95 degree days. This value for PHINT is appropriate
except for spring sown wheat in latitudes greater than 30 degrees north and 30 degrees south, in
which cases a value for PHINT of 75 degree days is suggested.
Stage 2
Stage 2 development, from terminal spikelet initiation to the end of leaf growth, is considered
strictly under temperature control and takes 3 phyllochrons from terminal spikelet to the appearance
of the flagleaf. Details of this evaluation are based on the work of E.J.M. Kirby and his co-workers
at the Plant Breeding Institute in Cambridge, England.
Stage 3
In Stage 3, the ear develops very rapidly and is a major sink for assimilates. At the end of this stage, the number of grains that will be filled per ear is calculated. The duration of stage 3 is the equivalent of 2 phyllochrons, even though no new leaves are appearing.
Stage 4
During Stage 4, the end of pre-anthesis ear growth to the beginning of grain filling, flowering
takes place. Some data indicate it takes 200 degree days during this stage to go from the maximum
ear size and volume to the time when linear grain mass accumulation begins. There are no apparent
above-ground sinks for assimilates during this development stage in that no plant part visibly expands.
The plant accumulates assimilate as stored carbohydrate during this stage for translocation to the ear
during the grain filling stage.
Stage 5
In Stage 5, grain filling, the size of the grain is determined. The thermal time for Stage 5
varies between genotypes and is determined by the input genetic specific constant P5. Although the
thermal time is not constant for all genotypes, all values for it are near 500 degree days. This stage
begins after flowering, i.e. 2 to 10 days after anthesis, with a rapid, usually linear, increase in kernel
weight.
Stage 6
Stage 6 is reserved for calculating the time from physiological maturity to harvest of the crop.
In the present version it is by-passed. This stage is set up for the CERES-Wheat user who needs to
consider possible yield reduction problems related to an inability to harvest the crop. The details,
however, are not included in the model as we could find no such dry-down model of wheat.
GROWTH AND ORGAN DEVELOPMENT
The purpose of the growth routine of CERES-Wheat is three-fold. The first purpose is to establish the leaf area of plants as the site of biomass production through the conversion of carbon dioxide and light energy to biomass. The second is to partition the produced biomass between the leaves, roots, stems, and ears. The last purpose, and the primary emphasis of CERES-Wheat, is to estimate grain yield as calculated by the product of the number of grains filled and their average weight.
The development of the growth routine in conjunction with the rest of the model has been a
major challenge in developing this model because the partitioning of assimilate is a dynamic process,
requiring several feedback mechanisms. It is hoped that refinements will be made in the procedures
developed for CERES-Wheat such that improvements in crop modeling will be realized.
DRY MATTER PRODUCTION
Monteith (1977) demonstrated that cumulative seasonal light interception for several crops grown with adequate soil water supply was closely related to biomass production. Although the calculated relationship for the different crops had different intercepts, there was considerable similarity. Radiation values were for those wavelengths in the photosynthetically active range and were assumed to be 50 percent of the solar radiation. Roots were included in the biomass yield even though the accuracy of the measurement of roots can be questioned. Although Monteith's results from crops in England have not been fully verified under conditions elsewhere where the radiation levels are often high, there is good reason to believe in their generality. Hesketh and Baker (1967) showed that the net photosynthesis rates of maize and cotton canopies, measured over 15 minute periods, had a nearly linear relationship to light interception.
Since studies have shown the linear relationship between biomass production and intercepted radiation, we attempted to use the constants published by Monteith (1977) to calculate biomass production in diverse regions of the world. From our results, we found that the constants obtained from that work for the conversion of intercepted radiation to biomass were too high for regions that had high daily radiation values. The field studies of Spiertz and van de Haar (1978), and Puckridge and Rathowsky (1971) demonstrated that the efficiency of conversion of intercepted radiation to biomass is greater during periods of low radiation than during periods of high radiation. This observation on the influence of radiation levels on the rate of conversion to biomass had been previously established for single leaves.
Inputs into the model for solar radiation are converted to photosynthetically active radiation (PAR), in MJ/m2/day, by multiplying the input radiation values by the constant 0.5. Use of this constant assumes that 50 percent of the incoming solar radiation is in the photosynthetically active range.
A major difficulty associated with verifying an intercepted radiation-biomass production relationship has been the lack of knowledge concerning the fraction of assimilate partitioned to the roots. Although several investigations were made to establish this relationship for use in CERES-Wheat by measuring roots or by approximating their weights compared to above ground biomass, there still remains considerable uncertainty in calculating the fraction of assimilate partitioned to the roots and tops. Several studies have reported rather large losses of the assimilate partitioned to roots through root exudations, sloughing, and other mechanisms. If these processes do indeed involve significant amounts of assimilate, then most measurements of root systems would give low estimates of the amount of assimilate transported to the roots. Because a goal of the model involved developing a reasonably representative root system, the amount of assimilate transported to the roots had to be approximately correct. To compensate for this, a somewhat higher efficiency of conversion of intercepted radiation to biomass was used than results from most field experiments have suggested.
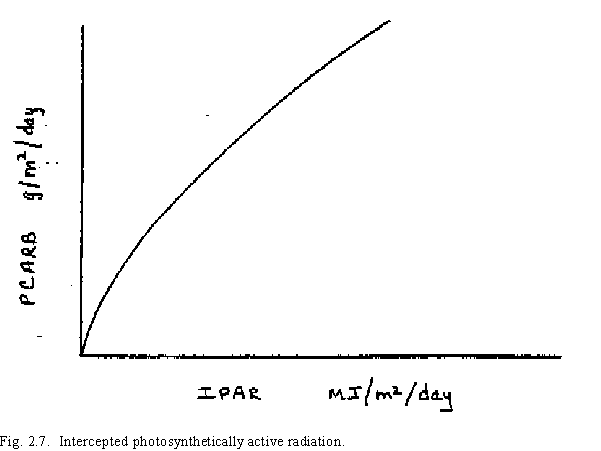
The equation used in CERES-Wheat for potential biomass production for a given day is:
where PCARB is the potential biomass production in grams/m2 and IPAR is the intercepted photosynthetically active radiation (Fig. 2.7).
The fraction of above-canopy radiation intercepted by the crop (IPAR) is calculated as a function of the leaf area index (LAI) by the following non-linear equation:
where LAI is the green leaf area of the blade per plant divided by the land area occupied by the plant. The value for LAI is calculated in another section of the growth routine based on an initial LAI value at emergence of 0.4 cm2. After the first day, the value for LAI comes from daily leaf expansion calculations.
Some investigators have appropriately included the area of leaf
sheaths exposed to light in the LAI. We assume that the proportion of sheaths exposed to light compared to the leaf blade area is a constant. Thus blade area is used for simplicity. The apparent extinction coefficient of 0.85 used in the intercepted radiation equation, therefore, is higher than some published extinction coefficients. This higher value offsets the smaller LAI value that results from using only blade area for the LAI. Although it was difficult to arrive at a precise value for the extinction coefficient, a sensitivity analysis using the range of values for the extinction coefficient suggested by others, 0.65 to 0.95, indicated that the accuracy of the extinct coefficient was not a critical factor in determining IPAR unless LAI values less than 1.5 persisted throughout a season.
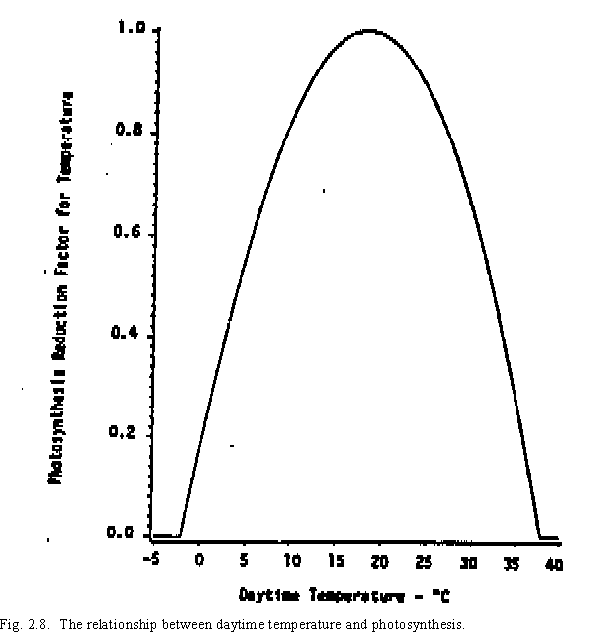
Two factors can reduce potential biomass production: non-optimal temperatures and water stress. A weighted daytime temperature is calculated from the minimum (TEMPMN) and maximum (TEMPMX) daytime temperatures for use in the photosynthesis temperature reduction factor (PRFT), where the optimum daytime temperature is considered to be 18`C. The daytime temperature (T) is approximated by the relationship
The reduction in photosynthesis due to temperature is then
for all values of PRFT greater than or equal to 0 (Fig. 2.8). Values obtained for PRFT that are less than 0 are set equal to 0..
Water stress reduces dry matter production rates below the potential whenever crop extraction of soil water falls below the potential transpiration rate calculated for the crop. This reduction factor, SWDF1, is calculated in the water balance sub-routine outlined in Chapter 3 and is used with PRFT to calculate the actual biomass production. The actual biomass production (CARBO) is thus determined by the equation
Respiration rates are assumed to be proportional to the carbon fixed by photosynthesis and are not calculated independently, but rather incorporated into the calculation of PCARB and PRFT.
The remainder of the growth component of the model involves the partitioning of assimilate
during the five phasic development stages. For this development, CARBO is converted to a per plant
basis by dividing CARBO by PLANTS, the plant population per square meter. Thus, a single plant
growing in competition with other plants is modeled. We assume that all plants for the area being
modeled are homogeneous.
LEAF GROWTH AND TILLERING
Plant leaf area has an important influence on light interception and dry matter production. The rate of leaf area expansion is a component of plant growth that is quite sensitive to environmental stresses. For example, leaf expansion growth is more sensitive to plant water deficits than is photosynthesis. Thus drought stresses reduce leaf expansion growth more than they reduce photosynthesis. This reduction in expansion growth without a concomitant photosynthesis decrease can increase the specific leaf weight or increase the proportion of assimilate partitioned to the roots. The model accounts for these plant responses by using separate water deficit functions for reducing leaf expansion growth and photosynthesis.
The daily increase in plant leaf area results from the growth of leaves on both the main stem
and the tillers. In the model, the area of the leaves on the main stem is first calculated; then an
adjustment then is made for the number of tillers on the plant.
DEVELOPMENT OF MAIN STEM LEAF AREA
The leaf area of a plant is the product of the rate of leaf appearance and the rate of expansion of the growing leaves. When only blade area is considered, we assume that only one leaf at a time is expanding on a stem during vegetative growth. Kirby et al. (1982) has shown that while two leaves are in an active expansion stage, only one of these leaves is contributing new, visible growth. The growth of the other leaf occurs within the sheath of the uppermost visible leaf and does not contribute to the leaf area available to intercept solar radiation.
The leaf appearance rate is a linear function of temperature between the range of about 0oC and 26oC (Fig. 2.1). Thus leaves appear at predictable intervals using known temperature information. The leaf appearance interval, PHINT, is also used as a basis for determining leaf area growth. Both the rate of appearance and the rate of leaf expansion are assumed to be controlled by temperature in the same way. Thus, leaf area growth rate can be calculated as a function of temperature without separately considering the individual leaf appearance and expansion rates.
The expansion rate of the first leaves on the plant is less than that of the later leaves due to the ability of the plant to acquire the assimilate to support larger leaves after more green leaf area is present. The first leaves of the plant, therefore, are smaller (Fig. 2.9). The plant leaf area growth rate on the main stem (PLAGMS) is determined from the following equation:
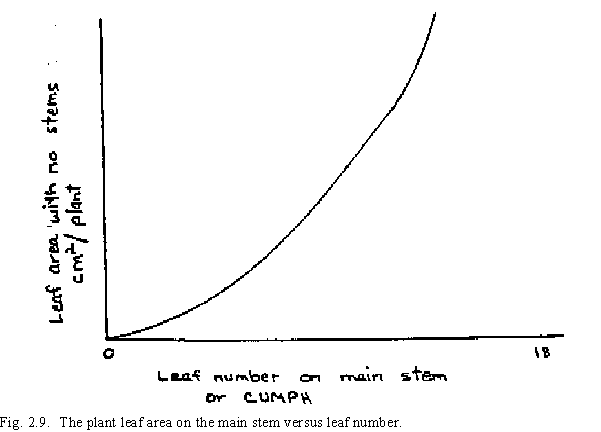
From the main stem plant leaf area growth rate, a first approximation of the total plant leaf area growth rate (PLAG) can be determined.
where TILN = the number of tillers/plant. The calculations for tiller number will be discussed in a later section.
To convert the leaf area growth rate into values describing the mass of growth obtained, we considered the only constraints on the potential leaf area growth to be a soil water deficit, which is imposed regardless of competition. This soil water deficit, SWDF2, is obtained from the soil water balance routine.
To determine the amount that leaves can grow, the leaf area to weight of assimilate ratio (AWR) is first calculated. The AWR in Stage 1 includes all of the above-ground biomass of the plant, which only consists of leaves, since the stem has a negligible contribution to the plant biomass in Stage 1. The AWR for Stage 1, early vegetative growth, is described by the equation
Although AWR can change more than the above equation implies, we found it difficult to allow AWR to vary with the environmental conditions along with other dynamic factors affecting partitioning. If AWR varies with environmental conditions, then it is difficult to control tillering development. Therefore in Stage 1, the model does not allow AWR to vary except with the aging of the plant. This is, however, only a consideration for Stage 1 growth since AWR is not used after Stage 1.
The potential leaf growth (GROLF) is the mass of assimilate required to support that amount of daily expansion growth in the plant and is expressed by
The root growth is then assumed to consist of the remainder of the daily assimilate supply.
If the root growth is more than 35 percent of CARBO in stage 1 growth, the plant is assumed to have an adequate assimilate supply for leaf growth to proceed at its potential rate (Gregory et al. 1978b). If GRORT is less than 35 percent of CARB, then GROLF is reduced such that its value is 65 percent of CARB and GRORT is therefore 35 percent of CARB. When this happens, a new value for PLAG is determined by
The total cumulative plant leaf area (PLA) is then updated by adding the daily growth:
The above considerations are used to account for the competition for assimilate between the main stem and the tillers.
Early in Stage 1, seedlings have a reservoir of carbohydrate available for leaf and root growth
in the seed endosperm. The model supplements the supply of assimilate with the carbohydrate from
seed storage until the seed endosperm storage capacity is depleted.
TILLERING
The total potential rate of tiller formation depends on the thermal time after emergence, as contained in the concepts developed earlier for cumulative leaves developed or cumulative phyllochrons (CUMPH). After three phyllochrons, tillers are assumed to be produced in direct proportion to the leaf number (Fig. 2.10),
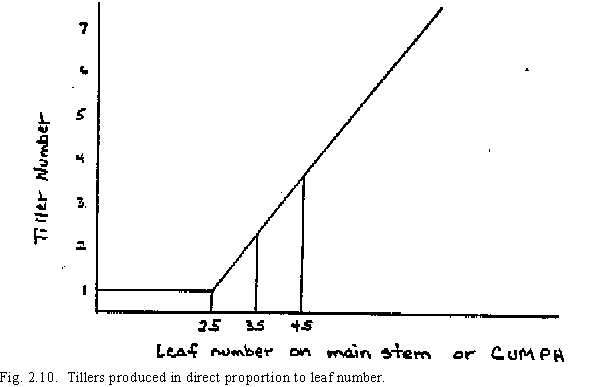
Although the rate of subsequent tiller formation by the main stem tillers would also follow this relationship, the actual number of potential tillers formed is limited by the available assimilate. This competition for assimilate between tillers is evaluated using the number of tillers per square meter (TPSM), where
where PLANTS is an input plant population. A rate of tiller formation based on the competition limitations of tillers per square meter is calculated:
The number of tillers per plant (TILN) is updated by the rate of daily tiller formation and is calculated as:
where TI = DTT/PHINT, the daily phyllochron fraction. For early tiller growth, TC1 is usually the minimum for the rate limiting function. As more tillers are formed, the rate calculated for TC2 is usually the minimum due to increased competition.
A water deficit factor can reduce tillering factor similar to the leaf growth rate, based on SWDF2 from the water balance routine.
If stresses or competition cause TILN to be less than one, it is assumed that the plant
population does not decrease. If TPSM is greater than 1000 at the end of Stage 1 growth, TILN is
reduced to 1000/m2. This is needed logically for later calculations and is based on the observation
that no more than 1000 tillers/m2 would be able to produce ears. The reduction is needed during
Stage 2 development where a reduction in tiller number due to assimilate competition is considered.
LEAF SENESCENCE
Leaf senescence is primarily coupled to plant leaf development. Several investigators have observed that each stem maintains only about four green leaves. Assuming that no other stresses cause early leaf senescence, senescence begins in the oldest leaves after four leaves have been formed. The plant maintains the four newest leaves as green leaves while the other leaves senesce. This type of senescence can be explained by both the shading of the older, lower leaves, by the upper, newer leaves, and by physical damage received by the older leaves as a result of stem expansion and leaf sheath splitting.
The plant leaf area loss rate (PLALR) is determined by
where PLSC is the cumulative leaf area at the time when each main stem leaf reaches full size, LN is the leaf number on the main stem accumulated since emergence, and TI is the daily phyllochron fraction.
From the above relation, the senescence leaf area (SENLA) is determined,
When soil water deficits are present, the plant leaf area senescence is increased by a factor related to SWDFI. From the plant leaf area PLA and SENLA, we now determine the green leaf area index, LAI.
where the constant 0.0001 converts leaf area units from cm2 to m2. The equations used to calculate senescence xx are used throughout the life cycle of the crop. Thus, when PLA reaches its maximum value at the end of leaf growth, senescence causes a gradual decline in LAI.
STEM GROWTH (Stage 2)
In the course of Stage 1 development, the number of tillers developed usually exceeds the number of tillers that can eventually develop stems and ears. Thus, the potential assimilate sinks exceed the supply. Under such conditions, the major challenge in the model becomes the proper partitioning of the available assimilate between stems, leaves and roots. The partitioning of the assimilate to the non-root parts of the plant is expressed by the relationship
where PTF = the top fraction of the plant. Thus PTF equals 0.8 under conditions of no water stress and 0.7 when conditions of the most severe water stress exist. After the assimilate is partitioned to the top portion of the plant, the remainder is allocated to the roots. Unlike Stage 1, in Stage 2 there is no minimum threshold percent of the assimilate obligated to be partitioned to the roots. Once PTF is determined, that fraction must be partitioned between the stems and the leaves.
After terminal spikelet formation at the end of Stage 1, the fraction of assimilate partitioned to the stem gradually increases from practically none to about 0.5 by the end of Stage 2. The rate of all stem growth, including tillers (GROSTM), is expressed by the following equation:
The rate of leaf growth (GROLF) is then determined:
During Stage 2, the new leaf area is considered to be proportional to the new leaf weight. This proportionality constant, 115 cm2/gm, assumes only leaf blade area while the leaf weight includes both leaf blades and sheaths. The total leaf area (PLA) is then updated,
TILLER DEATH
Tiller death is considered to result from an insufficient supply of assimilate to support tiller growth and maintenance. The assimilate demand by a single tiller is calculated, assuming that this demand is proportional to the rate at which the stem elongation can occur. This single stem elongation rate can vary considerably between plant genotypes. Dwarf or semi-dwarf genotypes have less demand per stem than genotypes with large stems. The rate of potential biomass gain for a single tiller is determined from thermal time and the weight of a single tiller (TILSW) updated by the following equation:
where G4 is the genetic specific constant (gm/stem). The constant G4 is by definition the final potential dry weight for a single stem plus ear at anthesis when the crop has grown under optimum conditions.
Once the single tiller demand for assimilate is determined, logic in the model provides a time-delayed balance with the assimilate supply to determine the number of tillers that can elongate under the assimilate constraints. This is accomplished by deriving a daily ratio (RTSW) between total plant stem weight and the potential plant stem weight if all tiller (TILN) stems could be the weight of the calculated single tiller TILSW.
where STMWT is the total plant stem weight. The time delayed reduced tiller number is updated with the equation
PREANTHESIS EAR GROWTH (Stage 3)
During Stage 3 development, plant growth continues to the end of preanthesis ear growth and has a duration that is the equivalent of two phyllochrons. The major growing parts during this period are the stem, ear, and roots. Because of the difficulty of knowing exactly when the major portion of ear growth is initiated and its relatively short expansion period, we do not distinguish between the weight of ear and the stem. In the model their weights are combined in the variable STMWT.
The fraction of daily assimilate partitioned to the top parts of the plant (PTF) is assumed constant unless there is a soil water deficit. The partitioning of assimilate to the non-root parts of the plant is similar to that used for stem growth in Stage 2 development,
This equation reflects a 5 percent increase in the portion of assimilate partitioned to the top parts of the plant as compared to Stage 2 development. The range of PTF is from 0.85 under conditions of no water stress to 0.75 under conditions of the most severe water stress. Similar to Stage 2 development, after the assimilate is partitioned to the top portion of the plant, the remainder of the assimilate is allocated to the roots.
The rate of potential biomass gain for a single tiller during Stage 3 is a linear function of thermal time multiplied by G4. Single tiller weight (TILSW) is updated by this rate
Similar to Stage 2 development, the single tiller assimilate demand is balanced against the assimilate supply and a reduction in tiller number is possible.
At the end of Stage 3 the minimum stem weight (SWMIN) is calculated. This value is assumed to represent the minimum stem weight that can occur when the stem reserve assimilates are used during grain filling. When the potential grain growth rate of the plant is such that the assimilate from photosynthesis is not sufficient to meet this demand, the stem carbohydrate reserves are used to meet this demand. When this occurs, the stem weight may decrease, but only to the minimum stem weight.
The plant leaf area reduction rate (PLALR) due to senescence in Stage 3 is:
where GPLA is the plant green leaf area (PLA - SENLA) at the end of Stage 2.
The senescence leaf area is then updated
END OF EAR EXPANSION TO THE BEGINNING OF GRAIN FILLING (Stage 4)
Stage 4 development has a duration of 200 degree days. During this stage, the plant has no above ground organs that actively expand. Carbohydrates are stored during this stage giving rise to an increase in stem weight. This reserve carbohydrate can later be transported to the grain. Stage 4 is important in establishing the grain yield because the stem plus ear weight at the end of this is assumed to be proportional to the number of grains that can be filled. Anthesis also occurs during this stage.
During Stage 4, 90 percent of the daily biomass produced is assumed to be partitioned to the plant top unless there is a water stress. Under conditions of water stress, this can be reduced to 80 percent.
We assume for simplicity that during stage 4 all of the weight increase in the plant top occurs in the stem and ear.
The plant leaf area loss rate () and the senescence leaf area (SENLA) are calculated for stage 4 development similar to that for stage 3, except that the rate is somewhat faster due to plant aging.
Water stress can increase the senescence rate. The updated leaf senescence is
At the end of Stage 4, the base temperature for thermal time determination is changed from 0 to 1 for the subsequent thermal time determination in Stage 5. The number of kernels per plant (GPP) is assumed to be the product of the total stem plus ear weight at the end of Stage 4 times a genetic specific constant, G2. This constant is used to account for varietal differences in the number of kernels produced per ear.
The value obtained for GPP from this calculation is not altered during the remainder of the plant's life
cycle unless severe water stresses cause the abortion of some of the grains during the grain filling
stage.
GRAIN FILLING (Stage 5)
We had difficulty in establishing the rate of photosynthesis for plants during grain filling when the leaves are aging. Root growth usually is negligible, and most data indicate that some of the assimilate used for grain filling comes carbohydrates stored in other plant parts. Most measurements of total above ground biomass production rates during the grain filling stage indicate a decline relative to earlier growth rates. Furthermore, an increase in maintenance respiration due to larger plant size should occur at this time. The assumption throughout all growth stages is that respiration is proportional to gross photosynthesis as altered by the temperature reduction factor discussed earlier. During this stage, this assumption may not be as valid as for the other stages.
The rate of photosynthesis could depend on the actual demand for assimilates during grain filling (Evans et al. 1975). Another possibility is that more assimilate is partitioned to the roots when the demand for grain filling is low. With these dynamic feedback mechanisms and the uncertainty of the amount of translocation to the grain, the scaling of daily photosynthesis was difficult. To estimate the amount of assimilate derived from photosynthesis and the amount from storage carbohydrate, the following relationships were used. The plant top fraction, PTF, during this stage is
where SWMIN is the minimum stem weight calculated at the end of stage 3 and STWMT is the stem weight. This allows more mass to be partitioned to the roots when there is a large supply of stored carbohydrates in the plant top.
When the stored carbohydrate has been used, all of the assimilate from photosynthesis then goes to grain filling, i.e. when SWMIN = STMWT. The range for the value of PTF is usually between 0.7 at the beginning of Stage 4 and to 1.0 at the end. As in other stages of development, the roots are assigned the fraction of assimilate not partitioned to the plant top fraction.
The rate of photosynthesis as influenced by aging of the leaves and sink assimilate demand is approximated using an equation that reduces the original calculated value of CARBO.
where P5 is the duration of grain filling in degree-days. The leaf aging affect is determined by the (SUMDTT + 100)/(P5 + 100) ratio in the equation and the sink demand is inferred indirectly through the SWMIN/STMWT ratio. This relationship is shown graphically in Fig. 2.11.
Senescence in Stage 5 is determined by a non-linear equation which considers the plant leaf area loss rate (PLALR) as the plant approaches maturity.
The kernel growth rate in Stage 5 is calculated on a single kernel basis and assumes that all kernels grow at the same rate. First a relative kernel filling rate is calculated as a function of temperature. The grain filling rate is assumed to be proportional to temperature between 0 and 17oC, with an optimum plateau temperature for rain filling above 17oC. If the mean temperature is less than 10oC, then the rate of grain filling (RGFILL) is determined by the equation
where TEMPM is the mean temperature and the rate of grain filling is not allowed to be less than 0. When the mean temperature is greater than 10oC,
RGFILL = 0.65 + (0.0787 - 0.00328 * (TEMPMX - TEMPMN)) * (TEMPM - 10)0.8.

The value of RGFILL is not allowed to exceed 1.
During grain filling plant water deficits only influence grain filling through the reduction in assimilate supply.
The daily whole plant potential grain growth (GROGRN) is calculated from the relative grain filling rate, the number of grains per plant, and the genetic constant G3.
where RGFILL is the actual grain filling rate, GPP is the kernels per plant, G3 is a genetic specific kernel growth rate constant, and 0.001 is a factor to convert units mg to g.
To calculate the actual rate of daily grain growth, it is necessary to determine if the photosynthesis plus stored assimilate supply is adequate to support the growth of all of the kernels. To do this, the value of GROSTM is calculated by adding the plant top biomass and subtraction of the potential grain growth.
Depending on the state of carbohydrate reserves in the stem and the daily assimilate supply, the value of GROSTM may be either positive or negative. The updated stem weight is then calculated.
If STMWT is greater than or equal to SWMIN, then the rate of kernel growth is equal to the calculated potential rate. If STMWT is less than SWMIN,
no further carbohydrate is available and grain the filling rate is equal to the daily biomass partitioned to the plant top. This reduction in grain growth usually only occurs near the end of the grain filling stage because the stored carbohydrates are depleted and the daily assimilation rate is low because of the reduction in green leaf area due to senescence.
The plant grain weight, (GRNWT) is updated by the actual grain growth rate (GROGRN).
The dry weight yield per unit area at the end of Stage 5 is calculated by multiplying the grain
weight per plant, GRNWT, by the plant population, PLANTS. This yield calculated in the model is
then corrected to include a grain water content of percent. If, at the end of grain filling, water
stress prevented individual kernel weights from attaining a weight of 20 mg, then the individual kernel
grain weight is assumed to be 20 mg and the kernel number is reduced to provide the calculated
whole plant grain weight. This is done to accommodate the observation that some grains are aborted
during severe drought while other grains remain relatively small but viable.
DEVELOPMENT OF THE ROOT SYSTEM
Root length density is needed to calculate root water absorption and to evaluate the soil water deficit factors that decrease various plant processes.
Throughout each stage of plant development, some assimilate was partitioned to the roots (GRORT). To simulate a root absorbing system it is necessary to convert root mass (GRORT) to root length. To account for biomass losses due to root exudations and sloughing, we assume that only 60 percent of the biomass partitioned to the roots is actually involved in structural root weight gains. Furthermore, an additional 0.5 percent of the root mass is assumed to be lost daily through respiration. The root weight is not, however, directly used in the model and is included with the model output for those interested in comparing the model result with field measurements. The conversion of GRORT to root length is based on the data of Gregory et al. (1978a)that there is about 1.05 X 104 cm root length per gram of root. Based on this approximation the daily new root length (RLNEW) is
where 1.05 is a constant that converts the daily biomass partitioned to the roots of an individual plant to cm of root length per cm2 of soil.
Because the model is not three dimensional in soil space, the root length calculations assume that the roots are equally distributed throughout the soil area. This assumption is not valid for young plants whose roots are concentrated near the seed. In some instances this model assumption can cause erroneous predictions.
The downward movement of roots is assumed to be proportional to the daily thermal time in the same way that leaf development is affected. Exceptions to this are when the soil is dry at the level where the roots are growing downward or when the plant itself is under water stress. When no stresses are considered, the downward rate of root growth is assumed to be 0.22 cm/degree-day. The downward rate of root growth is used to update
root depth (RTDEP)
where SWDF1 is a plant stress factor determined in the soil water balance routine, and SWDF is a water stress factor for the soil level where the roots are growing. The factor SWDF has a value of 1 when there is at least 25 percent of the total extractable soil water (ESW) at the depth where the roots are growing. If the ESW is less than 25% of then
where SW(L) is the water content at the depth increment (L) where the roots are growing, LL(L) is the lower limit of extractable water at that level, and ESW(L) is the difference between the drained upper limit soil water content (DUL(L) and LL(L). The limits of the soil water content at a particular soil level are discussed more fully in Chapter 3.
The distribution of the roots within the soil layers is evaluated by calculating a relative root length density factor (RLDF) at each soil depth increment (DLAYR(L)) where the roots are growing
where WR(L) is a root preference factor for each layer (L).
The root preference factor WR(L) is a soil input for each depth increment that depends on soil properties and ranges in value from 0 to 1. It represents the relative preference for root growth at the different depths if the soil water content and nutrient level are not below threshold values.
Several factors affect the distribution of roots at various soil depth levels. Model root formation occurs at the crown of the plant, usually causing a higher density of roots near the surface. Also, the upper soil levels generally contain higher amounts of nutrients and organic matter, causing more roots to develop there. The upper soil layers are also usually more easily penetrated by roots because they have been disturbed by tillage.
To obtain the distribution of new root growth with depth, a root length density factor (RLDF(L)) is calculated for each soil depth increment down to the lower boundary of the root zone (RTDEP).
RLDF(L) = WR(L) * DLAYR(L) * MIN (SWDF, RNFAC),
where MIN indicates that the computer will select the minimum value of the variables that are given in the parentheses. The value of SWDF is a limitation on root growth due to water shortage in a layer and has already been defined for root depth routines and RNFAC is a limitation on root growth due to nitrogen shortage. As with SWDF, RNFAC has a value ranging from 1 for no limitation to near 0 for a strong limitation on root growth.
RNFAC = 1.0 - (1.17 * EXP (-0.15 * TOTN))
where TOTN is the total nitrogen in the layer under consideration. Details on the nitrogen dynamics calculations are provided in Chapter 4.
The sum of the values of RLDF(L) for each layer with roots is calculated as a total root length density factor TRLDF. The fraction of new root growth at each soil depth then becomes RLDF(L)/TRLDF. The root length density RLV(L) for each depth increment is then updated.
where the last term calculates a one percent reduction in RLV(L) to account for root loss by death, sloughing, and other factors. The value of units of RLD(L) are cm root length per cm3 of soil.